2005 AP Micro FRQ#2 (Indirect Tax)
Watch me answer it here
https://youtu.be/YMCeq-VRTDU
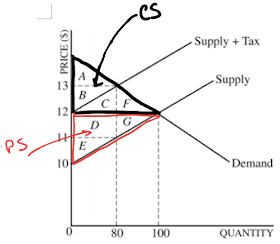
2. The graph above shows the market for a good that is subject to a per-unit tax.
(a) Using the labelling on the graph, identify each of the following.
(i) The equilibrium price and quantity before the tax.
The new price is $13 and the quantity is now 80.
(ii) The area representing the Consumer Surplus before the tax.
The area of Consumer surplus before the tax is everything above the price and below the demand curve.
Area ABCF = Consumer Surplus before the tax.
(iii) Producer surplus is everything below the price and above the surplus.
Area of Producer Surplus is DGE = Producer Surplus before the tax.
(b) Based on the graph does the price paid by the buyer rise by the full amount of the tax.
NO, as the demand curve is elastic and therefore the consumer and the producer will split the tax or the demand is not perfectly inelastic. If the demand was perfectly inelastic the producer could raise the price by the full amount of the tax.
(c) Using the labelling on the graph, identify each of the following after the imposition of the tax.
(i) Net price recieved by the seller.
Price recieved by the seller = $11
13 new price - $2 tax = $11 received by seller
(ii) The amount of tax revenue.
The amount of tax (government) revenue is the amount of the tax ($2)
multiplied by the new quantity sold (80) after the tax.
2 x 80 = $160 government revenue
Area = BCD
(iii) Area representing consumer surplus (after the tax).
The area of Consumer surplus after the tax is everything above the price and below the demand curve.
(iv) Area representing Dead-Weight Loss
It is the loss of CS & PS due to the reduced
amount of quantity that society actually gets.
Society is worse off due to the tax due to the
reduced quantity.
There is a loss of Total Surplus.


