
Sunday, January 25, 2015
Friday, January 23, 2015
AP Macroeconomic Exam GDP Questions (1995,2000,2005,2008)
Be smart, study the sections and understand the question. Do not try and memorize the question.
1995


1995
Answer (B) 7%
Answer (C) Closing overseas military bases and relocating those operations to the US.
Answer (D) II & III
2000
Answer (C) The government increases its domestic purchase of food for use by the military.
Answer (D) Households are demanders of the product market and suppliers in the factor market.
Answer (B) The price level is increasing.
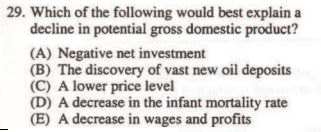
Answer (A) Negative net investment.
Answer (D) household production
Answer (A) not change, because there is no change in total expenditures.
2005
Answer (C) is adjusted for price level changes using a price index.
Answer (E) savings
Answer #34 (E) additions to business inventories
Answer #35 (C) 6%
Answer (C) Recipients of transfer payments have not produced or supplied goods & services in exchange for these payments.
2008
Answer (B) Nominal national income
Answer (C) 5%
Answer (D) Foreign companies build new assembly plants in the US
Answer (C) net exports were negative
Answer (E) a newly constructed home.
Sunday, January 18, 2015
Phillips curve Cheat Sheet
Tentative cheat sheet,,, I will be changing/adding some clarification in the next week. But here is the older cheat sheet. Helpful, I think, for matching the FRQ's with the Curve.
Notice:

Notice:
- a change in AD is a movement up/down the SRPC
- a change in SRAS is a shift of the SRPC
- There is no trade-off between inflation and employment in the Long-run.
Aggregate Demand & Supply/ Phillips curve Cheat Sheet
I wanted to match the AD/AS curves (that you have to know) and the Phillips curve. (that you also have to know)
As the AP exam gives us a starting point/trigger. ((a)The economy is in recession), it many times also wants the phillips curve to be shown in relation to the AD/AS curve.((b) Assume the economy is in recession).
The AD/AS curve with its matching Phillips Curve graph. (I think these are correct, but if you see a mistake or need a copy, (wcwaugh@aol.com))
Aggregate Demand
Aggregate Demand
Aggregate D&S is heavily tested on the AP. Know it all.
Aggregate Demand - refers to the total spending on domestic goods and services over a period of time.
Definition: total planned spending on domestic goods/services at various possible average price levels per period of time.
Spending come from:


If spending decreases for any of the above reasons, then the Price Level (PL) will decrease and output will decrease, unemployment will increase.
PL - decreases
Output - decreases
Unemployment - increases


Aggregate D&S is heavily tested on the AP. Know it all.
Aggregate Demand - refers to the total spending on domestic goods and services over a period of time.
Definition: total planned spending on domestic goods/services at various possible average price levels per period of time.
Spending come from:
- Private sector: (households and firms)
- Public sector: (government)
- Foreign sector: (net exports) = (exports minus imports)
Private sector: includes:
- (C) consumption from households & (I) investment from firms
Public sector includes:
- (G) government expenditure
Foreign sector includes:
- (Xn) foreign sales of domestically produced goods and services minus imports
GDP = C + I + G + Xn
I like to think of the AD/AS curve as showing all the things that are happening during the year and GDP is more of a snapshot at the end of the year (a point in time). The AD/AS curve is a representation of what has gotten us to the final place (GDP).
Yet, AD (aggregate demand) is like the microeconomic demand curve in that it shows an inverse relationship between how much is demanded and prices. There are things that affect the price level and thus, shift AD, just like the demand curve in micro.
First, lets look at the AD/AS curve in Equilibrium
The AD/AS curve is in equilibrium.
The PL (price level is stable)
There is full employment or at the NRU (Natural Rate of Unemployment)
***Comparisons between the AD/AS curve and the PPC, at AD/AS Equilibrium,, society is producing on its PPC Curve - The economy is utilizing all of its resources efficiently. We are producing at point B on the PPC when the AD/AS curve is in Equilibrium.
I find that students learn quicker when they always start problems by drawing the equilibrium graph and then change the graph according to what happens in the economy.
(My advice) always start from equilibrium and then show the change.
(C) Consumption/Changes in Consumer Spending
(shifting of the AD curve)
(focus on what happens to the price level, unemployment & output)
Notice that AD has shifted to the left, there has been a decrease in the PL (Price Level), Output has fallen & we can assume that the economy is in Recession and unemployment has increased.
What are the Consumption/ Changes in Consumer Spending triggers that have caused the decrease in AD?
- Consumer Income decreases - (Consumer Income decreases, then spending decreases)
- Wealth decreases - (value of assets decrease (house values) then spending decreases)
- Taxes increase - (Taxes increase - disposable income decreases - spending decreases)
- Interest Rates increase - (Interests rates increase - investment decreases)
- Expectations about the future economy could be pessimistic. - (if expectations about the economy worsen then citizens will want to have more cash on hand for emergencies and will therefore spend less)
If spending decreases for any of the above reasons, then the Price Level (PL) will decrease and output will decrease, unemployment will increase.
PL - decreases
Output - decreases
Unemployment - increases
Or, there could be a shift right of the AD curve due to the opposite action:
(I) Investment - Spending by firms on capital equipment/technology and by households on housing.

(Xn) Net Exports - net exports equals exports (X) - imports (n)
(G) Government Spending (fiscal policy)
Monday, January 12, 2015
Aggregate Supply Short-Run
Aggregate Supply (AS): is defined as the planned level of output that domestic firms are willing to offer at different average price levels per period of time.
Short-run aggregate supply (SRAS) - the period of time in which money (nominal) wages are assumed fixed over the short-run and unable to adjust to changes in the average price level.
Why, fixed?
1) Contracts cannot be broken.
2) Workers are slow, unaware of price level increases/decreases and therefore are slow to recognize their purchasing power has been affected.
 SRAS Curve
Upward sloping as Price Levels (PL)'s rise, firms enjoy larger profits and therefore produce more.
Shifting of the SRAS Curve: Right

Causes of the shift right of the SRAS curve: (decrease in production costs)

2) GDP: decrease
3) Unemployment: increase
2000 AP Macroeconomic Exam
 Answer (C) - wages are a cost of production. Lower wages and aggregate supply will shift right.
(A) an increase in interest rates will increase the costs of production, (leftward shift of SRAS)
(B) increasing taxes would increase production costs (shifting SRAS left)
(D) mandates on pollution increases production costs (leftward shift)
(E) shutdown and movement of goods equals higher production costs. (left shift)
2000 AP Macroeconomic Exam

Answer (A) an increase in productive resources will shift the SRAS curve to the left.
(B) Productivity increases lower production costs and therefore would shift the SRAS right.
(C) Increases in the money supply would lower interest rates and shift AD right.
(D) A budget deficit implies that money is being spent, a rightward shift of AD.
(E) Imports increasing means that exports relatively are decreasing, AD shifts left.
2005 AP Macroeconomic Exam

Answer (C) III the cost of all inputs (production costs)
Interactive AD/AS practice
Short-run aggregate supply (SRAS) - the period of time in which money (nominal) wages are assumed fixed over the short-run and unable to adjust to changes in the average price level.
Why, fixed?
1) Contracts cannot be broken.
2) Workers are slow, unaware of price level increases/decreases and therefore are slow to recognize their purchasing power has been affected.
Upward sloping as Price Levels (PL)'s rise, firms enjoy larger profits and therefore produce more.
Shifting of the SRAS Curve: Right
Causes of the shift right of the SRAS curve: (decrease in production costs)
- Decrease in wages (not in the SR)
- Increase in physical capital stock
- Increase in technology
- Increase in subsidies
- Decrease in business taxes
- Expectations that the price level will decrease
1) Price Level: decrease
2) GDP: increase
3) Unemployment: decrease
Shifting of the SRAS Curve: Left
Causes of the shift left of the SRAS curve: (increase in production costs)
1) Price Level: increase- Increase in wages (not in the SR)
- Decrease in physical capital stock
- Decrease in technology
- Decrease in subsidies
- Increase in business taxes
2) GDP: decrease
3) Unemployment: increase
2000 AP Macroeconomic Exam
(A) an increase in interest rates will increase the costs of production, (leftward shift of SRAS)
(B) increasing taxes would increase production costs (shifting SRAS left)
(D) mandates on pollution increases production costs (leftward shift)
(E) shutdown and movement of goods equals higher production costs. (left shift)
2000 AP Macroeconomic Exam
Answer (A) an increase in productive resources will shift the SRAS curve to the left.
(B) Productivity increases lower production costs and therefore would shift the SRAS right.
(C) Increases in the money supply would lower interest rates and shift AD right.
(D) A budget deficit implies that money is being spent, a rightward shift of AD.
(E) Imports increasing means that exports relatively are decreasing, AD shifts left.
2005 AP Macroeconomic Exam
Answer (C) III the cost of all inputs (production costs)
Interactive AD/AS practice
Aggregate Demand & Supply Cheat Sheet
Aggregate Demand & Supply Cheat Sheet
(Need a bigger copy of the below? E-mail wcwaugh@aol.com)
Tentative,, AP FRQ Cheat sheet. It is very clear that the bulk of recent past exams have been moving from equilibrium/ recession to recession/recession-LR. Still, knowing that in the short-run, the SRAS curve (usually) does not shift and so a movement during this time usually starts with fiscal policy actions (government spending) that increases AD to push the economy back to equilibrium. Get familiar with the terminology of how the College board asks these questions (triggers), you must understand all of these graphs!!!!
I'll write that again, in the short-run (For the AP) the SRAS (usually) does not shift,, only AD.
(As some questions are stand alone questions this rule is for questions that usually involve starting the economy in equilibrium or recession,, moving into recession and then the government refraining from action. Over time prices and wages adjust, a shifting of the SRAS)
In the Long-Run , SRAS shifts moving the economy back to equilibrium.

Let me see if I can be a bit more clear.
The SRAS curve obviously can shift in the Short-Run as it does when Negative supply shocks occur 2004B & 2006(Stagflation) or when Positive supply shocks occur (Economic Growth) or when the government decides to lower business taxes(2004B) to offset the effects of Stagflation. (think, Keynesianism)
The difference being that SRAS shifts on its own in the long-run to offset happenings in the economy. If the economy has been experiencing inflation (rising production costs) the firm will (in the long-run) begin to reduce employment and output, while passing higher costs onto consumers as higher prices. The economy will return to equilibrium (with higher PL's),, the point to be taken away is that in the LR the economy will be self correcting with a shifting of the SRAS curve. (think classical/monetarists economists and flexible prices & wages).
(Need a bigger copy of the below? E-mail wcwaugh@aol.com)
Tentative,, AP FRQ Cheat sheet. It is very clear that the bulk of recent past exams have been moving from equilibrium/ recession to recession/recession-LR. Still, knowing that in the short-run, the SRAS curve (usually) does not shift and so a movement during this time usually starts with fiscal policy actions (government spending) that increases AD to push the economy back to equilibrium. Get familiar with the terminology of how the College board asks these questions (triggers), you must understand all of these graphs!!!!
I'll write that again, in the short-run (For the AP) the SRAS (usually) does not shift,, only AD.
(As some questions are stand alone questions this rule is for questions that usually involve starting the economy in equilibrium or recession,, moving into recession and then the government refraining from action. Over time prices and wages adjust, a shifting of the SRAS)
In the Long-Run , SRAS shifts moving the economy back to equilibrium.
Let me see if I can be a bit more clear.
The SRAS curve obviously can shift in the Short-Run as it does when Negative supply shocks occur 2004B & 2006(Stagflation) or when Positive supply shocks occur (Economic Growth) or when the government decides to lower business taxes(2004B) to offset the effects of Stagflation. (think, Keynesianism)
The difference being that SRAS shifts on its own in the long-run to offset happenings in the economy. If the economy has been experiencing inflation (rising production costs) the firm will (in the long-run) begin to reduce employment and output, while passing higher costs onto consumers as higher prices. The economy will return to equilibrium (with higher PL's),, the point to be taken away is that in the LR the economy will be self correcting with a shifting of the SRAS curve. (think classical/monetarists economists and flexible prices & wages).
Subscribe to:
Comments (Atom)