Wednesday, November 23, 2016

Least-Cost Rule

Least-Cost Rule
The Resource Costs Cheat Sheet is here.

Least Cost Rule: production at least cost requires the ratio of labor’s marginal product to its price equals the ratio of capital’s marginal product to its price. The amounts of labor and capital employed must be adjusted, all the while keeping output constant, until this condition is achieved.

Simple, yes. (NO)  The least cost rule comes into affect when the college board asks us to evaluate two inputs for production. Labor and Capital,,, workers and machines. 


We are usually given two inputs, (labor and capital) and asked to evaluate which we need to buy more. 

First - Let's create our own simple problem. 

The price of labor is $10 and the price (rent) on capital is $20. The marginal product of labor is 40 and the marginal product of capital is 60. Should we hire more labor or more capital?

Remember the formula:

Set up the numbers:

What does this mean: 
The marginal product of the last input of labor was 40 units produced and that labourer was paid $10. So for each $1 spent we received 4 units produced. 40/10 = 4
&
The marginal product of the last input of capital was 60 units produced and the rent was $20. So for each $1 spent we received 3 units produced. 60/20 = 3

Answer - Obviously we would want to hire more labor as (per dollar spent) on labourers produce a higher level of output. We want the biggest bang for the buck.

This is the simplest most straight forward way of presenting these problems don't expect it.
The legend of John Henry stands strong in American Folklore. Legend has it that Henry’s prowess as a steel driver was measured in a race against the new steam powered hammers being used to drill into rock to make holes for explosives to blast tunnels for the railroad back in the late 1800’s. In a battle of man versus machine, Henry outdueled the steam powered technology, only to die in victory with his hammer in his hands as his heart gave out from the stress. Where it actually happened, or if it even happened at all, will always be in debate but the legend will always be a firm reminder of how technology finds itself taking over tasks previously done by hand.

(2012 AP Multiple Choice)

Answer - (A) The marginal product per dollar spent on labor is equal to the marginal product per dollar spent on capital.

2000 AP Multiple Choice Question

To answer this question you must understand that the Profit Max rule is about setting the ratios equal to one. There is a point where the right combination of labor and capital is maximised, this is always at the profit max (MR=MC) point on our graphs.  If we are at Profit Max then the least cost rule is attained/satisfied.

Lets plug in some numbers: for answer (A)
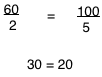
This combination of capital and labor we would want to hire more labor.


Lets plug in the numbers for (E)
Answer (E) Both sides (ratios) equal each other. We are at profit max = least cost combination.

2008 AP Multiple Choice Question

Formula:
or
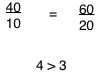
OK, so we can see clearly that we would want to hire more (increase) labor as the output per dollar is greater for labor. But, the confusion is should we choose answer (D) or (E).

The marginal product of the last input of labor was 40 units produced and that labourer was paid $10. So for each $1 spent we received 4 units produced. 40/10 = 4
If we increase the amount of labor we hire the MP will fall due to diminishing marginal returns. 

&
The marginal product of the last input of capital was 60 units produced and the rent was $20. So for each $1 spent we received 3 units produced. 60/20 = 3
If we decrease the amount of capital we hire the MP will rise due to increasing marginal returns.

Remember, it is the least-cost rule, we want the least inputs we can hire(rent) to get to profit max. 

Answer - (E) Increase labor and decrease capital.

(Practise Problem)


Answer (A) make no changes as the mix of inputs (last dollar spent yield the same marginal product)

(Practise Problem)

Answer (D) less labor and more capital.

 (FRQ Practise)
then...

or
(10,000/1,000) = (50/w)
(W = 5)


Monday, November 21, 2016

2009 B Microeconomics FRQ #1

2009 B Microeconomics FRQ #1


Watch me anser it here

(A) Draw a CLG for Mary & Company and show each of the following.

(i) The profit max output and price, labelled as Qm & Pm respectively.

(ii) The area of loss shaded completely.


(B) What must be true in the short run for the company to continue at a loss?

Memorise this phrase, " In order for a company to continue operation at a loss it must be covering its variable costs (labor). You will see this again.


(C) Assume now that the demand for cleaning products increases and that the company is not earning short-run economic profits. relative to this short-run situation, how does each of the following change in the long-run.

(i) The number of firms.

Increase - In the long-run more firms will enter the market as profits attract firms.

(ii) The company's profit.

Decrease - In the long run the firm will be in long-run equilibrium making zero economic profit.

(D) In the long-run if the company continues to produce, will it produce the allocatively efficient level of output? Explain.

Remember that the industry is a monopolistically competitive industry, 
In the long-run the allocatively efficient level of output will not be produced. 

Monopolistic Competition Cheat Sheet is here.


(E) In  the long-run will the company be operating in the region where 
economies of scales (EOS) exist.
Absolutely - 
First, You must know what economies of scales looks like. Economies of Scale is the left half of the LRATC curve. It means that even though quantity in the industry is increasing costs for those resources are falling. 

EOS post is here.

Now, look closely at the graph you were to have drawn and notice 

Even when the firm is in long-run equilibrium it will still be operating in the downward sloping section of the ATC and therefore in the EOS region.


Friday, November 18, 2016

2009 B Macroeconomics FRQ #3

2009 B Macroeconomics FRQ #3


Yes, that is the Canadian Prime Minister, Trudeau.


(A) Using a CLG of the foreign exchange market (FOREX) for the Canadian Dollar, show the effect of the higher real interest rate in India on each of the following.

FOREX Cheat Sheet is here.

(i) Supply of the Canadian dollar. Explain.

If the interest rate in India rises above the Canadian interest rate then Canadians will move their money (capital flows) to India to get the higher interest rates. But you have to be careful, the question is actually asking about the Supply of Canadian dollars in the FOREX, NOT the supply of Canadian dollars in Canada.

Think of it like this,,,, The FOREX is a place in the sky. "I know but be patient".
On one side is Canada with its 5% interest rate on the other is India with its 8% interest rate.

Now Canadians would like to invest their money in interest assets to get the 8%. What is an interest asset? Bond. So Canadians would like to buy Indian bonds that promise to pay 8% a year.

But, the Indian banks do not accept Canadian dollars. So the Canadian investors must exchange their Canadian dollars for Indian Rupees in the FOREX. "In the sky"


Now, since Canadians are dumping their Canadian dollars in the FOREX, the supply of Canadian dollars is increasing. Why?

Capital Flows "I know, in AP economics Capital means machinery not cash/money" but not all of the world has taken AP economics.

Capital Flows from countries with lower interest rates to countries with higher interest rates. Why? If I take my money from a bank in Canada, where my money is earning 5% a year and move it to a bank in India where my money will earn me 8% a year then I will be financially better off. Always seeking higher earnings.


(ii) The value of the Canadian dollar, assuming a flexible exchange rate.

If the supply of Canadian dollars is increasing in the FOREX, then the value of the Canadian dollar $ will fall. Supply increases then value falls relative to the Indian Rupee ₹.


(B) Using a graph of the loanable funds market in Canada, show how the increase of the real interest rate in India affects the real interest rate in Canada.

Understand, that the loanable funds market graph is a model of the cash in banks. If cash is leaving Canada and travelling to India, then the supply of loanable funds in the banks in Canada is decreasing. Therefore the RIR (real interest rate) in Canada is rising.


Recognise, that when speaking about the supply or demand of Canadian dollars or Indian Rupees the College Board is speaking to the supply/demand in the FOREX.

Loanable Funds is the supply/demand of Canadian dollars/Indian Rupees in that country's banks.


2009 B Macroeconomics FRQ #1

2009 B Macroeconomics FRQ #1

Watch me answer it here


(A) Using a CLG of AD/AS, show the current equilibrium RGDP, labelled Yc, and PL in Southland, labelled PLc.
Understand that the phrase unemployment is greater than the natural rate of unemployment is code for recession.

I always start my AD/AS curves from Equilibrium and then draw in the effect of what's going on in the question.
Example:
Show means to draw & label graph correctly, use arrows showing effect & describe with correct terminology what is happening.

The President of Southland is receiving advice from two advisors. Kohl's and Raymond - about how best to reduce unemployment.

(B) Kohelis advises the president to decrease personal taxes.
(i) How would such a decrease in taxes affect aggregate demand? Explain.

A decrease in taxes is an expansionary policy action, like if the government had increased spending. So, a decrease in personal taxes increases the disposable income in people's pockets and therefore they will spend more, increasing (C) consumption and AD will increase. AD increasing will push increase output and more people will go back to work. 


From the Fiscal Policy Cheat cheat sheet here.


(ii) Using a CLG of the SRPC (short-run phillips curve), show the effects of a decrease in taxes. Label the initial equilibrium as (A) and the new equilibrium from the decrease in taxes as point B.


Phillips Curve cheat sheet is here.

Check yourself 
If the PL increases and unemployment has decreased on your Phillips curve, your AD/AS curve  after the personal tax decrease should have the same effects. 

(C) Raymond advises the President to take no action.

(i) What will happen to the SRAS curve in the Long-Run? Explain.

Understand that "take no policy action" is code for "in the long run".

So, if there is a recession and the government does nothing, two things will happen. 

1) Prices will fall - which will stimulate quantity demand
2) Wages will fall - unemployed will accept lower wages - employers will hire more people as wages fall

Wages is an input cost (resource cost) - it also is a determinate of supply. If wages for a firm fall then the supply curve shifts rightward and more output is produced. If the wages in all of society fall, then the SRAS curve shifts rightward and output/RGDP increases. If output increases then unemployment falls.


(ii) Using a CLG of the SRPC (short-run phillips curve), show the effects of a change in the short-run aggregate supply you identified in part (c)(i).

Understand that if AD shifts on the AD/AS curve it is a movement on the Phillips Curve, but if AS shifts it is a shift of the Phillips Curve. 

PL decrease
Unemployment decreased

So, What would the AD/AS curve look like for Recession "In the long-run"
From the Phillips Curve Cheat Sheet here.