Tuesday, May 23, 2017

2017 AP Microeconomics FRQ #3

2017 AP Microeconomics FRQ #3

(A) Identify the monopolists.
(i) Profit maximising quantity
(ii) Profit maximising price
Recognise, that the MPC is the MC curve and that the MR = MPB, therefore the Profit Max for this Monopoly is where MR = MC, 
Price = P4 
Quantity = Q3

Answer


(B) What information in the graph indicates that there is a negative externality?

MSC > MPC = Negative Externality

Answer


(C) Identify the socially optimal quantity.
Social Optimal Quantity is where MSB = MSC
Social Optimal Quantity = Q3

Understand: This time the monopoly is producing an output that is equal to the socially efficient amount, Here the welfare losses caused by the negative externality are less in a monopoly environment than they would be in a competitive environment. This is a point worth remembering when it comes to things like energy markets. People naturally assume that competitive markets are better than ones with market power, but if there is a negative externality of pollution that comes with consuming energy, then the economic welfare effects may be less bad for society if there is a monopoly or oligopoly provider producing a lower amount at higher price for consumers (and enjoying high profits) than if there was a competitive market, prices were forced down for consumers, and an excessive amount of energy was consumed.
Answer

(D) In the case in which the government imposes a per-unit tax equal to the marginal external cost, identify each of the following.
(i) The dollar value of the tax, using the price labels from the graph

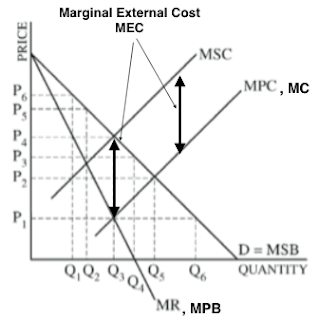
The tax would be equal to the vertical distance between the MSC and MPC. (P4 - P1) 

(ii) The profit-maximising quantity associated with the tax.

Answer


(E) Given the monopoly facing the negative externality, would the dead-weight loss increase, decrease, or stay the same as a result of imposing the per-unit tax? Explain.


Answer

2017 AP Microeconomics FRQ #2

2017 AP Microeconomics FRQ #2


Watch me answer it here, 


(A) If the firm uses one unit of capital and one unit of labor, will it be operating with constant, increasing, or decreasing returns to scale? Explain using numbers from the table.

Ok, if we are talking about Returns to Scale, then we must be talking about the long run.
If the firm is using one unit of labor with one unit of capital in the short run, and then we compare the additional output that can be produced by doubling not only labor but also Kapital the we see that the returns have more than doubled.

When we have 1unit of labor and 1 unit of Kapital we can produce 10units of output
but if we double the amount of labor to 2units and double the Kapital to 2units we can produce 50units of output.

By doubling all inputs the output more than doubled from 10 - 50 units.

Answer

(B) Assume now that the firm currently has two units of capital and is using three units of labor.
(i) Calculate the marginal product for the third unit of labor. Show Your Work.


So if we are using K2, then we have moved into the present short-run with K2, so compare the K2 numbers. I found it useful to just combine the Labor costs and the costs of K1, and then add the additional cost of K2 ($75). 

1 Unit of Labor - Labor ($200) + K1 ($75) + K2 ($75) = $350
2 Units of Labor - Labor ($400) + K1 ($75) + K2 ($75) = $550
3 Units of Labor - Labor ($600) + K1 ($75) + K2 ($75) = $750

Marginal Product is simply 50 to 75, which is a marginal product of 25 for the 3rd worker.

(ii) Did the firm experience diminishing marginal returns with the addition of the third unit of labor? Explain using numbers from the table.

The firm experienced diminishing returns with the addition of the 3rd unit of labor. The marginal product of the 3rd worker is 25, which is less than the marginal product of the 2nd worker which is 30.

(DECREASING MARGINAL RETURNS: In the short-run production of a firm, an increase in the variable input results in a decrease in the marginal product of the variable input.)


(iii) Calculate the firm's average total cost for its current level of production.  Show Your Work.


The average total cost is sometimes referred to as the per unit total cost since it is calculated by taking the total cost of production and dividing that by the number of units produced (quantity). In variable form, it looks like this: 
TC / Q = ATC
Where fixed costs + variable costs (quantity) = TC

ATC is total costs (labor and capital) divided by the amount of total output.

(iv) If the firm's output is sold in a competitive market, what is the lowest output price at which the third unit of labor would be hired?

  So, if I understand this question, they are asking what is the lowest price (of the good) that would make hiring worker number 3 possible.

Again, This problem has challenged my summer mind. Take the answers with a grain of salt. 
Trust but verify. This is like when you buy a used car, if it breaks in half after you drive it off the lot, you own both pieces.

My thinking is that the cost of capital (K1 & K2) aren't added into the marginal cost numbers as capital in the short-run is considered fixed and therefore not included in the marginal cost.
Therefore,
This makes sense as as we add more labor and as marginal product decreases then marginal costs must be increasing.

Where MRP = MRC, Marginal Revenue Product = Marginal Revenue Costs
MRP (what the worker brings in) = MRC (what the worker costs)

If our MRC, is $200 then to be able to hire the 3rd worker she must at least bring in $200, where 
MRC = MRP.
Since we know that the MRP is MP x P (of the good), then the minimum that the output price of the good could fall would be $8.

Answer


2017 AP Microeconomics FRQ #1

2017 AP Microeconomics FRQ #1


Watch me anser it here


(A) Draw a CLG for the corn market and a representative corn farmer (Firm). On your graph show each of the following.
(i) The equilibrium price and quantity in the corn market, labelled PM & QM.
(ii) The profit maximising quantity of corn produced by the representative farmer earning zero economic profit (normal profit) labelled QF.
 Answer
(B) Assume the demand for ethanol increases. On your graph in part (A) show what will happen to each of the following in the short-run
(i) The market price and quantity of corn labelled P* & Q*.
(ii) The area of profit or loss earned by the corn farmer. Shaded completely.

If the demand for Ethanol increases then the demand for corn must increases as corn is an input for Ethanol.
Answer


(C) Relative to your answer in part (B), state what will happen to the market equilibrium price and quantity of corn in the long-run. Explain.

Profits in the short run, attract firms
Firms enter in the long-run
Firms enter and produce more Supply, Supply increases
Increased Supply means quantity produced increases
Increased Supply drives prices lower
Answer

(D) Soybeans are produced in a perfectly competitive market. Assume farmers can grow either corn or soybeans on the same land. What happens to the price of soybeans in the next planting season if the price of corn increases? Explain.

Ok, if the price of corn increases farmers will want to plant more of it as the profits on each bushel will be greater than on a bushel of soy beans. So farmers switch from soybean production to corn production hunting for profits. This reduces the supply of soybeans in production. Less supply means hire prices for soybeans.


Corn and Soybeans are considered competitively (supplied) produced goods.

Answer


(E) Assume instead that the government sets a binding price ceiling in the corn market.
Draw a new CLG of the corn market and show each of the following.
(i) The binding price ceiling, labelled PC.
(ii) The quantity purchased by consumers in the corn market, labelled QC.

Understand that a binding price ceiling is one that is below the equilibrium point. Binding also means effective which implies it must effect the market and an effective price ceiling is one that is below equilibrium.
Remember that ceilings are low, and floors are high.
Answer