
Growth - the increase of real GDP over time.
This can be shown in a number of ways.

On the PPC, movement from point A to point B is an increase in efficiency, usually point A is represented on the AP as unemployment. That which reduces unemployment causes a movement from A to B.
The shifting out of the PPC (B to C) This can include more efficient use of resources, trade, increase in resources (finding of oil deposits) and increases in human capital (education and training) which implies increases in productivity.
Any point on the PPC boundary is where resources are being employed efficiently and is referred to as Potential GDP. Potential as this is the best a society could achieve with the available resources.
If the LRAS curve shifts to the right it implies that the full employment level of real output has increased. This means that there has been an increase in at least one of the following: technology, population, education, resources or capital stock. Productivity is thought of as a major driver of economic growth as labor productivity implies greater output per worker which is achieved through investment in natural capital, human capital and physical capital.
Lets look at how the AP has used productivity in questioning students with multiple choice.

Answer - (E) More efficient steelmaking process
Technological improvements that increase the productivity of workers.

Answer - (C) Long-run aggregate supply
We see the connection between the PPC and the LRAS being questioned.

Answer - (B) The LRAS curve shifts right
Growth implies an increase in productivity

Answer - (E) LRAS shifts right
Again, technological improvements imply higher levels of productivity

Answer - (C) RIR increase
Capital stock, labor supply, tech, and increases in human capital all increase the long-run growth rate.

Answer - LRAS shifts right
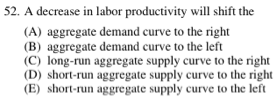
Answer - SRAS curve left
I think the idea is that decreases in productivity must be a short-run effect. Interesting!

Answer - (C) population decreases
There are a few things going on that I don't like. First, the AP is testing you to see if you understand that a reduction in population (war, disease) will shift the LRAS curve leftward. Second, the confusion arises in my mind because standards of living will not improve if there is war and/or disease. So this question seems to imply that smaller populations promote higher standards of living. I disagree. This question in my mind is contradictory and confusing.

Answer - (C) Labor Productivity
Draw a graph of the AD/AS Growth and notice that the PL has decreased and Output has increased.

Answer - (A)