Sunday, November 18, 2018

Resource Costs (Labor) Lesson #1

Lesson of Labor #1
Labor
(How many workers to hire)

What we know - 
Law of Diminishing Marginal Returns - as I add more and more inputs (labor) to  fixed capital (factory, machine) the amount produced by each additional unit (worker) will initially increase but eventually decrease. 
Look at the MP curve

So, as we add each worker the marginal product of each additional worker initially increases but will eventually fall. 

***If all workers are paid the same wage, at some point the next worker hired will produce less in revenue than the value of the wage that I pay. I would not want to hire that person as they will cost me more than they earn in production.
    
Ex. John only produces two units of a good and I sell each for $5, my total marginal revenue from John is $10,, If the wage I pay John is $12 a day he is costing me money to employ him.
Sorry John, but you should be fired.


The question  - "how many workers do I hire?"

1st  - What is our demand for labor. D - This is a Derived Demand

Our Derived demand for labor is based on how much each worker brings into the company and this is effected by two things
1. P - Price of the Good Sold
2. MP - Productivity of each (additional) worker

Derived Demand - the demand for labor is based on two things PG & MP

1. The price of the good (PG) the worker is producing. 
If our workers are producing hats and the market price of hats increases then we want to produce more to make more profit and this implies that we will hire more people. 

Law of Supply
As the price of a good increases
the Q
S of that good increases.
So, if the PG (Price of the good we produce) increases in price we make more on each unit of the good produced and therefore want to make more and must hire more workers to produce the additional quantity.

2. The productivity of each additional (marginal) worker. 
If the productivity of our workers increases (think technology). If new machines make each individual worker more productive then we make more revenue on each worker and therefore want to hire more workers.
Determinate of Supply
As technology increases more
of this good is created
So, if the productivity (MP) of our workers increase then each worker brings into our company more revenue and we hire more workers to make more product to increase our profits.

Marginal Revenue Product (MRP)
is the DL based on the PG & the (MP)

Marginal Revenue Product (MRP) is the Demand for Labor (DL) and is derived from the Price of the Good Sold (PG) & the Marginal Product (MP) of each individual worker.


Understand that the MRP is the amount of marginal revenue attributed to each worker added.
worker 1 brings in $50 of additional (marginal) revenue
worker 2 brings in $40
worker 3 brings in $20

* Notice above that MP initially increased but the continually decreases - Why??


What if the PG increase, what happens to the MRP?

What if the MP increase, what happens to the MRP?

So, what we see is that if the PG increases or the MP increases, then the MRP will increase and our DL will shift to the right.


Marginal Revenue Cost (MRC)
also called Supply of Labor (SL) curve 
This is simply the wage rate/ price of labor
For a perfectly competitive labor market it is a straight line.
They can hire all the workers they want at a specific price.
Recognize that this curve can also be called the
Marginal Factor Cost (MFC) or Marginal Resource Cost (MRC) curve
 or the Supply of Labor (SL) curve
The question  - "how many workers do I hire?"
Your profit max for hiring workers is where the MRP and the MRC curve 


Saturday, July 7, 2018

2018 AP Microeconomics FRQ #3

2018 AP Microeconomics FRQ #3
(a) Nirali spends 3 hours studying microeconomics and 2 hours studying history. Calculate her gain from the second hour spent studying history.


First, we should recognize that the Expected Score is the expected Output (grade) gained by studying a certain number of hours. For instance, if I study one hour my expected score will be a 40 on the exam, and if I study an additional hour (2) I'll add 20 points to my score. My marginal score from 1 hour studied to 2 hours studied is 20. I gained 20 points by studying and extra hour.


(b) Calculate Nirali's opportunity cost of time spent studying that second hour of history.

(c) Assume that Narali increases the time she allocates to studying history. What happens to the opportunity cost of studying history? Explain.

We would assume that opportunity cost would increase. Her Opportunity cost (what she gives up) by studying more history is a worse score in Micro. 


(d) Assume that Narali has a goal of maximizing the sum of her test scores. How many hours should she study for each?

It's clear by looking at the marginal gains, that the best choice is 3 hours of history and 2 hours of Micro.
At 3 hours of history and 2 of micro we gain a total score (utility) of 72 + 82 = 154
At 2 hours of history and 3 of micro we gain a total score (utility) of 60 + 90 = 140
At 4 hours of history and 1 of micro we gain a total score (utility) of 77 + 60 = 137

(e) Nirali gains an additional hour where will she allocate it? Explain using marginal analysis.

The 3rd hour of micro gains her 8 points while the 4th hour of history only gains her 5 points.
8 > 5 so choose the additional hour of micro.


2018 AP Microeconomics FRQ #2

2018 AP Microeconomics FRQ #2

Watch me answer it here


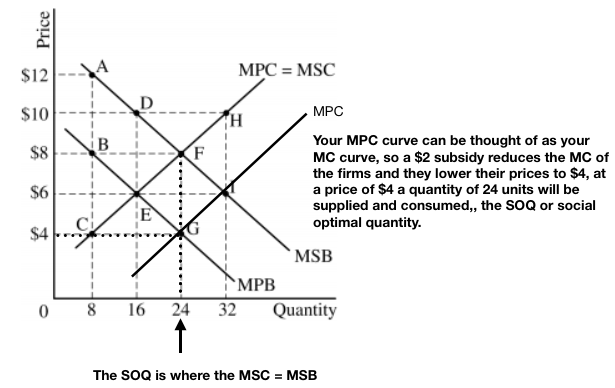
(a) Identify the type of market failure illustrated by the graph. Explain.
The type of market failure is an Positive Consumption "Externality".

(b) Using the numbers on the graph, identify the market equilibrium price and quantity.

(c) Using the labeling on the graph, identify the area representing DWL at the quantity identified in part (b).
Part (b) is the equilibrium price of $6 and quantity of 16, the DWL at that quantity is EDF.

(d) Suppose the government is granting a subsidy to correct the market failure. What is the dollar value of the per unit subsidy to achieve the SOQ (Socially Optimal Quantity)?

(e) Suppose the government installs a price floor at $8,
(i) How many units will producers and consumers exchange? (8)
(ii) Does the Price floor correct the market failure?
NO, it actually makes it worse,, society would like 24 units consumed but after the price floor only 8 units are consumed.
College Board
Thou canst not vex me with inconsistent mind,
Since that my life on thy revolt doth lie.
O, what a happy externality do I find,
Happy to have thy love, happy to die!


2018 AP Microeconomics FRQ #1

2018 AP Microeconomics FRQ #1


Watch me answer it here


(A) Draw a correctly labeled graph for Single Cinema, and show
       (i) The profit maximizing price and quantity of tickets labeled as Pm and Qm respectively.
       (ii) The area representing the negative economic profit (loss) shaded completely
(B) Explain why Single continues to operate in the short-run despite earning negative profits.

Understand that as long as Single is at least paying some of its fixed costs and it isn't at the shut-down point (P = min AVC) then it should continue to operate. 

The distance between the AVC and the ATC represents fixed costs (costs that don't change with additional output) if by being in business we are making a loss but are still paying some of our fixed costs we should remain in business because if we shut down, all of our fixed costs are due.
Think of it like this, we pay $500 a month in rent, rent that is due every month no matter if we produce any product or not. If by being open we are making a loss of $100 a month, we are still paying $400 of our fixed costs (rent). If we shut down we owe the entire $500. As long as we stay open even when making a loss we will be covering some of our fixed costs. If the price falls below the minimum of the AVC (Shut-down point) we can't cover any of our fixed costs and now some of our VC (variable costs) can't be paid, variable costs include labor. 

(C) Would Single's total revenue increase, decrease or stay the same if it decides to sell one ticket less than Qm? Explain.

Recognize that if Single reduces it's quantity by 1 the price will increase, as the monopolist only produces in the elastic section of its demand curve, an increase in price means a decrease in total revenue.


(D) Single hires workers in a perfectly competitive labor market with a downward sloping demand curve. Suppose the number of workers available in the market decreases.
   (i) What will happen to the wage rate? Explain.
   (ii) What will happen to the MRP of the last worker hired.  Explain.

(i) Number of workers decreases = Supply of labor decreases = Wage increases
(ii) Understand that the MRP = MP x Pg (Marginal Product x the Price of the Good Sold)
The MP of each worker decreases as more workers are added to the fixed capital = diminishing marginal returns so the reverse of this would be that every person not hired (fired) would have a hire MRP that the preceding one.


PPC Cheat Sheet - Updated

PPC Cheat Sheet - Updated 07/01/2018


Friday, July 6, 2018

2018 AP Macroeconomics FRQ #3

2018 AP Macroeconomics FRQ #3


2018 Macroeconomics FRQ #2

2018 Macroeconomics FRQ #2


Watch me answer it here


2. Assume the economy of Ucheleand is currently at full employment. The government of Ucheland reduces the tax rate on household interest earnings.

1st you must know what household interest earnings are -   interest that people earn on the savings in their bank accounts. If the government reduces the tax on those savings, then people will save more...

(a) What will happen to private savings in Ucheland?
 Private savings will increase.

(b) Draw a CLG of the loanable funds market, and show, the effect of the change in private savings identified in (a) on the equilibrium real interest rate.
(c) Given the Real Interest Rate change identified in part (b), answer the following.

(i) What is the short-run effects on aggregate demand? Explain.

If the supply of loanable funds increases, driving the RIR to fall, then citizens will be more likely to take out loans and invest. Investing will shift the AD curve rightward.

(ii) What is the long run effect on the potential real GDP. Explain.
 I believe this question is asking about growth in the Long-Run. 
Potential GDP is the curve on the PPC. = Any point on the PPC boundary is where resources are Allocatively efficient and referred to as Potential GDP. Potential, as this is the best a society could achieve with all available resources actively engaged.

Understand that these questions are always the same. LR Growth FRQ's here


PPC Cheat Sheet here

If there is more investment, then we assume that some of this new investment will be investment in capital formation, this new capital creation will push out the PPC boundary = more LR Growth.