2010 B Micro FRQ #1


(A) Assume that the private firm owns the bridge and maximises profits. Determine the output and price.
This is why we learn the MR=MC rule and apply it to all maximising profit companies. Look for MR=MC and follow the lines, even when the college board thinks up a strange question like this.
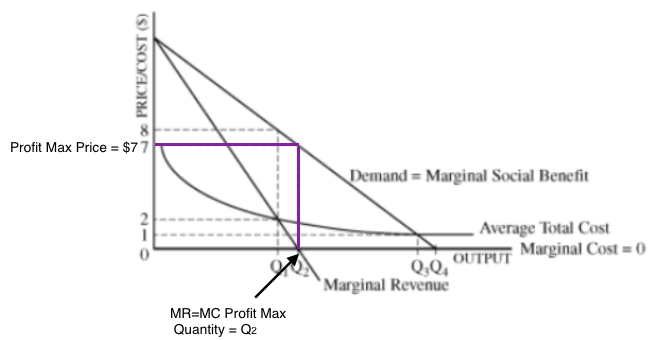

(B) Now assume that a municipality owns the bridge and sets the price to achieve allocative efficiency . Determine the output and price.
From the Monopoly Cheat Sheet here.

Recognise and understand that Allocative Efficiency is where P = MC.


(C) At a price of $1, is the municipality's accounting profit positive, negative or zero? Explain.
Understand Accounting Profit: Profit Cheat Sheet Here.
Remember that Zero Economic Profit is positive accounting profit. At a price of $1, P = ATC.
This is a fair return or break-even price the monopolist will be making a normal or zero economic profit.


(D) Suppose the municipality sets a break-even price that generates revenue just to cover all economic costs.
(i) Based on the graph, determine break-even output.

(ii) At the output you determined in part (D)(i), is the demand relatively elastic, relatively inelastic, perfectly elastic, or perfectly inelastic or unit elastic.


(E) If a company provides access to the island via watercraft, what will happen to each of the following?
 (i) The demand curve for bridge crossing.
(ii) The profit maximising output.
If demand falls then output necessarily falls.

(F) Suppose the long-run average total cost curve is strictly downward sloping, would it be efficient to build a second bridge? Explain.
I have no problem stating that this problem is poorly worded and stumped quite a number of teachers of economics. Along with myself.
Take a step back and think about what you know:
1) The demand for this good is inelastic
2) Fair Return/ Break-Even price is $1
3) A competing water taxi will reduce demand for our bridge#1
4) The socially optimal quantity (SOQ) is 4 autos at a price of zero
5) To get more people to cross our bridge you would have to pay them - also inefficient
6) Building bridge #2 with a price of zero will just attract autos away from Bridge #1, & increase fixed costs and therefore Average Total Costs
7) This will raise Bridge #1's ATC's as the Demand curve for Bridge #1 shifts leftward.
8) Overall the municipality's ATC's will increase = inefficiency
I think,,, that the clue here is the understanding that allocative efficiency (Socially Optimal Quantity) is produced at a quantity of Q4. with a price of zero. Remember that the quantity is the number of cars crossing the bridge during the day and at a price of zero,, 4 autos cross that bridge. This is what society values as it is the SOQ and allocatively efficient level of production ..
Saying it another way,,,, If with one bridge at a price of zero demand is met. Then if we build a second bridge, the demand curve for bridge #1 will shift leftward (substitute) and its ATC's increase.
Saying it another way,,, There is no demand for a second bridge as the first bridge serves the socially optimal quantity (4) without raising the price above zero... in essence, because they are in the economies of scale section of the LRATC curve there is no reason to increase fixed costs (build another bridge) as the costs are still falling with increased production,,,, There is no reason to increase our fixed costs (bridge #2) until we have the need or demand.
One more point,, Obviously we want to produce were our ATC curve is lowest and as we are experiencing economies of scale we want to produce more but this is only efficient if there is enough demand. There isn't enough Demand. If we build a second bridge our fixed costs will increase and therefore our ATC will increase. This would makes us less efficient.


