
LRAS/ LR Growth Cheat Sheet here

Understand that LR Growth is a Rightward shift of the LRAS Curve
The LRAS Curve shifts due to the 6 things above
but
the College Board mostly
links LR Growth with an increase in Capital Formation (Stock)
Capital Stock is more equipment/factories/machinery
that will allow us to produce more in the future
and
Capital Stock (Formation) is created when there is more investment
and
Investment increases when Interest Rates are lowered
So,
When Interest Rates decrease there is an increase in Investment,
some of this Investment is in the form of Capital Formation and
therefore LR Growth Increases
2019 AP Macroeconomics Exam (Set 2)

(A.) Above Full Employment = Demand Pull Inflation

(C.) Government = Fiscal Policy action = GS decreases, Taxes Increased, Transfer Payments Decrease
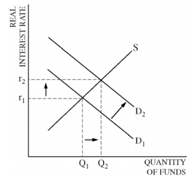
(D.) Due to Fiscal Policy actions draw a loanable funds graph
If Government spending decreases there will be less demand in the
loanable funds market shifting the DLF curve to the left, the RIR decreases
either of the Loanable Funds graphs below are acceptable as both show the
RIR decreasing
Understand - If the DLF is decreasing that implies there must
be a larger amount of Loanable Funds in the banks
therefore the SLF increases
decreasing the RIR

***(E.) Given the RIR decreasing what is the affect on the LRAS curve (LR Growth)? Explain.
If the RIR is decreasing
Then investment will increase
If investment increases then we can assume
some of that investment will be in Capital Formation
more capital formation
is a rightward shift of the LRAS curve
and therefore more LR Growth

2018 AP Macroeconomics Exam

(A.) What will happen to private savings?
If the tax on savings is reduced then people will save more
private savings will increase

(B.) Loanable funds graph, show the effect of an increase in private savings on the interest rate.
 |
| More savings shifts the SLF curve to the right. |

(C.)
(i) What happens to the AD curve?
If the Interest rate falls investment increases therefore AD increases, shifts right.

***(ii) What is the Long Run effect on the Potential GDP? Explain.
If the RIR decreases then investment will increase
capital formation increases
Potential GDP, LRAS, LR Growth increases

2017 AP Macroeconomics FRQ

(A.) Draw a PPC, X = Full Employment = Potential GDP

(B.) Assume there is an increase in national savings, draw a Loanable funds graph showing the change in the real interest rate.
Savings increase the SLF shifts right
more loanable funds, lower RIR

(C.) Show a new combination of consumer and capital goods on your PPC and label it Z, that is consistent with the increase in an increase in savings.
 |
| An increase in savings, causes the SLF to increase Lowering the RIR, which increases investment More investment means more capital goods Therefore Z is an increase in capital goods production |
(D.) Due to C will the LRAS curve shift? Explain.
If the SLF shifts right the RIR will fall
Lower real interest rates will increase investment as
investors like cheaper loans
they will invest by creating capital goods
this increase in capital goods will increase the LRAS curve
LR growth will increase as
will potential GDP

2015 AP Macroeconomics Exam


(A.) Operating below full employment = Recession Draw a Graph.

(B.) The government lowers taxes (expansionary fiscal policy). What happens to?
(i) Aggregate Demand --- Increases
****(ii) Long Run Aggregate Supply? Explain.
Lowering taxes will increase disposable income
some of this tax savings will make it into the banks
increasing the supply of loanable funds
this will decrease the RIR
Investment will increase
Some of this investment will be capital formation
More capital formation =LRAS curve shifts right
 |
| As you can read above,, explanation is important do what you think is best and what makes the most sense to you |

2014 AP Macroeconomics Exam


1. Below full employment level of Real GDP = Recession
(A.) Draw a AD/AS

(B.) US Increases government spending by 100b, financed by borrowing (from the loanable funds market), how will the following be affected?
(i) Cyclical Rate of Unemployment
The cyclical rate of unemployment is only during recessions and inflation
therefore if we are in a recession the cyclical rate of unemployment is quite high
government spending will increase consumption and AD
output increases putting people back to work
therefore cyclical unemployment will decrease.
(ii) The Natural Rate of Unemployment = NRU
The NRU is composed of Frictional and Structural unemployment
not cyclical
therefore government spending and a rightward shift of
aggregate demand doesn't affect the the NRU
NO change to the NRU
(D.) Using a loanable funds graph show the effects of the 100b of Government spending.
Government Spending Increases the RIR
as the government spends its borrowing
the SLF decreases driving up the RIR

**(E.) Based on the RIR change in (D.) what is the effect on the LR growth Rate?

When the Government spends the government has to borrow
the borrowing reduces the supply of loanable funds
this drives up the RIR
this reduces investment (loans)
therefore there is less
capital investment
capital formation
capital stock
capital accumulation
and less LR Growth

2013 AP Macroeconomics Exam


(A.) Using a AD/AS graph, show the economy in equilibrium

(B.) Personal Savings increase, draw a graph of the loanable funds market show the impact on the RIR.
 |
| More savings = more SLF = RIR decreases |
(i) Interest sensitive expenditures = Investment = Increase
(ii) Rate of Growth? Explain.
Are we bored yet?
If the RIR decreases, more investment = more capital formation = more LR Growth

2012 AP Macroeconomics Exam

(A.) Draw a AD/AS in LR Equilibrium
(B.) There is an increase in Exports.

(C.) What is the impact of higher exports on the real wage? Explain.
An increase in exports increases AD and increases the PL
PL increase reduces the Real wage
the Real wage is the amount of stuff your Real wage can actually buy
If the PL increases your wage buys less stuff
your purchasing power has decreased
If Nominal Wages (the wage you get paid)increase by 10%
but
Inflation (the PL) increases by 20%
your real wage has decreased by 10%
(D.) Due to an increase in Exports the shipping company invests in new container ships and equipment (Capital goods).
(i) What component of Aggregate demand will change - Investment
(ii) What is the impact on the LRAS curve? Explain.
More capital goods means a rightward shift of the LRAS curve
more LR Growth

2010 AP Macroeconomics Exam

(A.) Draw a AD/AS graph of the economy in LR Equilibrium.
(B.) Government spending increases on national defense.

(D.) The government borrows from the public, using the loanable funds graph show how the borrowing effects the RIR.
 |
| As the Government Borrows the Demand for Loanable funds increases the RIR Increases |
(i) Investment - Decreases
Interest Rates are the Price of Money
If interest rates are high the Price of Money is high
Less people Borrow/invest when the interest rates are high
(ii) Economic Growth Rate, Explain.
If the RIR is increasing, there is less investment
less investment means less capital formation
less capital formation means less LR-Growth

2009 AP Macroeconomics FRQ

(A.) People move their money out of Tara, how does this affect the value of Tara's currency.
As Tara's citizens move their currency out of Tara
they dump it into the FOREX, this increases the supply of Tara dollars in the FOREX
as the supply increases (in the FOREX) the value of the Tara decreases

(B.) Using a graph of the Loanable Funds market show the impact of of this decision on the RIR.
as the Tara, leaves Tara banks the SLF of Tara dollars decreases
the RIR increases

(C.) Given your answer in (B.), what happens to the rate of growth in Tara. Explain.
As the RIR in Tara increases there is less investment
less investment means less capital formation
less capital formation means less LR Growth

2008 AP Macroeconomics Exam

(C.) We need 500b of GDP
(i) Calculate the minimum increase in Government spending to get to full employment.
If the MPC is 0.8 then the MPS is 0.2
The GS multiplier is 1/MPS = 5
500b/5 = 100b of GS
(ii) Assume instead taxes are reduced. Larger or Smaller. Explain.
The Taxing Multiplier = MPC/MPS or .8/.2 = 4 Taxing Multiplier
or
Just know that the Taxing Multiplier is always 1 less than the Gov't Spending Multiplier.
500b/4 = 125b of a Tax Decrease
The Taxing multiplier is less than the Gov't Spending multiplier because if the Government Spends all of that spending immediately flows into the economy increasing consumption and people's incomes and therefore GDP
but if taxes are reduced some of that tax savings will saved not spent and
therefore
taxes will have to be reduced by a larger amount than Government Spending
(D.) Loanable funds graph showing the increase in Government spending.


(E.) How will the interest rate change effect the Growth Rate of the economy? Explain.
If the Government spends it must be borrowing
therefore the SLF is decreasing and the RIR increases
Higher RIR will decrease investment
and capital formation
Less capital formation means less LR Growth.

2007 AP Macroeconomics Exam

(A.) Business are granted a tax credit, draw a loanable funds graph showing the effect of the tax credit on the Real Interest Rate
Tax Credits are best explained as money the Government
will give to you for spending on certain things that the Gov't wants more of.
If you spend $1m on Technology then at the end of the year the Gov't gives you $1m
Think of it like a subsidy -
The government wants more people to invest in Technology and Investment
so they will replace any money that you spend on technology and investment
If a business knows it's money spent on research, technology, machinery will be refunded by the government at the end of the year it will be more inclined to take out a loan to fund the research, technology, machinery.
More loans demanded = RIR Increases
This is a very tiring explanation, sorry

(B.) Now instead, the government reduces the tax you must pay on savings. Draw a loanable funds graph showing the effect on the RIR.
 |
| As the government lowers the tax on savings, more families will save and therefore the SLF curve shifts right as more people put their savings in the banks. More loanable funds RIR decreases. |

(C.) Given your answer to part B what happens to the PPC curve (LRAS) in the Long-Run?
As the RIR falls more people will be inclined to take out loans
some of that investment will be in the form of capital formation
more capital formation implies LR Growth
LRAS curve shifts right
PPC shifts out

2005, 2003, 2002, 2001 and 2000 all have
LR Growth questions answered the same way.
