Economies of Scale
Economies of scale can be classified into two main types: Internal – arising from within the company; and External – arising from extraneous factors such as industry size.
Internal has to do with efficiencies stemming from the fact that the company has become larger. Example: Due to the company now printing 10,000 flyers for their new product, cost per flyer has decreased. Companies tend to be able to negotiate lower prices for larger bulk orders. The lower costs push the short-run average total cost curves down and to the right.
External economies of scale have more to do with broad changes in the industry. Example: the introduction of computers into the business world have lowered costs for all businesses that choose to accept them.
The AP tends to ask questions about EOS in the multiple choice section and the FRQ section but they are looking for different aspects of the same thing.
I've tried to create a graphic to help explain EOS. Let's see if it can help.
First, lets look at the MC questions:
Answer - B The firm doubles its inputs and and output triples
If we look at the graph above we see EOS and increasing returns to scale on the left side of the long-run average total cost curve. Costs (EOS) are falling as output increases due to efficiencies. The doubling of inputs and output tripling is an example of increasing returns.
EOS or increasing returns to scale.
EOS tend to have to do with a firm's costs while returns to scale have to do with addition of inputs and outputs in the long-run. They of course are closely related. I would say that the above question is a more increasing returns to scale question but I don't write the questions. Know that the AP exam relates the two as closely connected.
First Multiple Choice
Answer - E Long-run average total cost decrease as output increases
Again, by looking at the graphic above we see the LRATC curve is showing decreasing costs as output increases.
Economies of Scale has to due with long-run changes in the scale of production.
Answer - Diseconomies of scale
Answer - (a) The price will remain unchanged
(Demand increases and supply responds by increasing and pushing price back down to the original price)
The graphic above shows the differing ways that the sections can be referred to on the AP exam.
Second FRQ's
The FRQ section of the AP gives you a guide when in the initial section of the question they speak about (Increasing cost industry -Decreasing cost industry - Constant cost industry) This is a warning that the LRATC curve will be discussed and you will be required to evaluate what happens to prices in the industry due to where the firm is on its LRATC curve.
2015 Microeconomics question #1
A constant-cost industry????
So in this question the firm is earning a positive profit, and profits attract other firms (firms enter) and supply increases which pushes the price lower.
The question would/could be how much lower as in lower than the original price, higher than the original price or equal to the original price.
In a constant cost industry supply will increase until the price is equal to the original price.
Example:
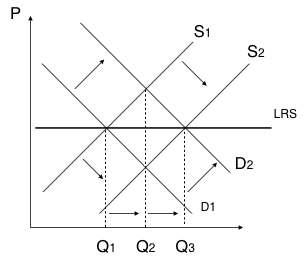
So initially something happens in the short-run in the market, Demand increases. (D1 to D2)
This causes profits in the industry, profits firms enter, firms enter and supply increases (S1 to S2)
Supply increases to the original price. If a line is drawn between the original and the new equilibrium points we would get a horizontal line, this line is the Long Run supply curve.
2011B Microeconomics #1
Increasing Costs Industry - the firm is operating on the right side of the LRATC curve.
Here is what happens:
(C) Demand shifts right - price increases - causing profits -
(D) (i) Profits attract firms (more firms) - supply increases - pushing down the price
Here is the important part::::
(ii) The firm's Short-run average total cost curve shifts up - it is an increasing cost industry - costs are increasing -
(i) Price has increased more than Pf.
(ii) Price is less than Pf2
If we look closely, we see that in an increasing costs industry, supply increases but not enough to lower price back to the original price.
2008 Microeconomics #1
Constant Cost industry *****
So, Perfectly Competitive, Constant Cost in Long-run equilibrium
(b) Lump sum is given, which creates profits for the firm in the short-run
(iii) Number of firms can't change in the short-run,, tricky
(c) Indicate how changes in the Long Run
(i) Number of firms in the industry (Profits - firms enter - increases)
(ii) Price - Price will return back to the original price (price falls)
(iii) Industry Output
(Demand increases and supply increase, price returns back to original price as it is a constant cost industry) Output in the industry increases


