Sunday, November 2, 2014

Monopoly 4 - Break-even & Shut-down

Monopoly 4 - Break-even & Shut-down 

Break-even

A monopolist with its price exactly equal to its ATC, Notice the ATC is just kissing the Demand curve.
  • MR = MC
  • TR = TC
  • Covering all of its implicit and explicit costs.
  • Earning a normal profit but not any positive economic profit
2006 AP Microeconomics FRQ, Q1

Look at (IV) The museum maximizes its attendance, as long as it breaks even. (As long as it covers its costs) Look at where the ATC crosses the Demand curve, remember the Demand curve is also the Average Revenue curve, so TR = TC at P2 & Q5.


2010B AP Microeconomics FRQ, Q1
Again, break-even where ATC crosses the Demand curve.
2008B AP Microeconomics FRQ, Q1
Again, break-even where ATC crosses the Demand curve.

Shut-down


Shut-down if:
  • price can sell for is lower than the firms average variable cost, or
  • if total losses are greater than the firms's fixed costs.

in the graph:
  • firm is producing at MR=MC level of output, price is lower than the firm's AVC
  • firm cannot afford to even pay its workers for each unit they produce
  • Shut-down to minimize losses
No shut-down FRQ,s I've found in the last ten years,, anyone know anything different leave a comment.


Monopoly 3 Loss Minimization

Monopoly 3 Loss Minimization 

Yes, monopolists can have losses, 
  • demand for its product could fall
  • costs could rise
  • governments might demand they make losses (while providing subsidies)
Notice, the firm is producing at profit max, MR = MC, but the ATC is higher than the price it can sell its good. 

2012 AP Microeconomics Exam, FRQ, Q1


Monopoly video - Louis CK - Monopoly Loss


Monopoly 2 - Profit Maximization

Monopoly 2 - Profit Max

1995 AP Microeconomics Exam
Answer (D) Less than the socially optimal level, since the price paid by consumers exceeds the                        firms marginal cost. (To answer this question you must know what a profit                                    maximizing monopoly firm actually looks like, and what the socially optimal level                         is.(Discuss Later))
Just like a perfectly competitive firm a monopolistic company wants to produce where profit maximization occurs. (Profit Max is where MR = MC)

First, find the Profit Max, where MR and MC intersect, draw a dotted line straight up until you bounce off of the Demand (price) curve and continue until your line bumps into the Price axis. This is your Profit Max price. Go back to where MR and MC intersect and draw a dotted line down to the output axis. This will be the amount of product that will be produced (Output) at that price.  Notice, in the graph above the section of the ATC curve (where it intersects with the dotted line) is below the price. Costs are being covered, as price is above ATC's. Profit is to be shaded in and labeled profit, In the long term due to barriers of entry the monopoly firm can continue making profits in the long term.

1995 AP Microeconomics Exam
Answer (B) charge a higher price than is necessary to maximize revenues. (Remember a monopoly can choose price or output not both.)

2000 AP Microeconomics Exam
Answer (A) Price exceeds MR marginal revenue (the demand curve (price) is greater than marginal revenue simply because to sell more, the monopolist must lower its price which applies to all of the previous units as well.)

2000   2000 AP Microeconomics Exam
Answer (B) its profit max output is 200 units. (Did you choose (A) because you followed the Max profit across to $5. Remember, Profit max price is found by tracing the line up to the Demand curve and then turning left, Profit max price is $20) 

Economic profits = (P-ATC) x Q   ($20-$10) x 200 = $2000 profits are sustainable in the Long-run due to barriers to entry.


(Monopoly with a straight MC curve, don't let that confuse you.)

2013 AP Microeconomic FRQ, Q1


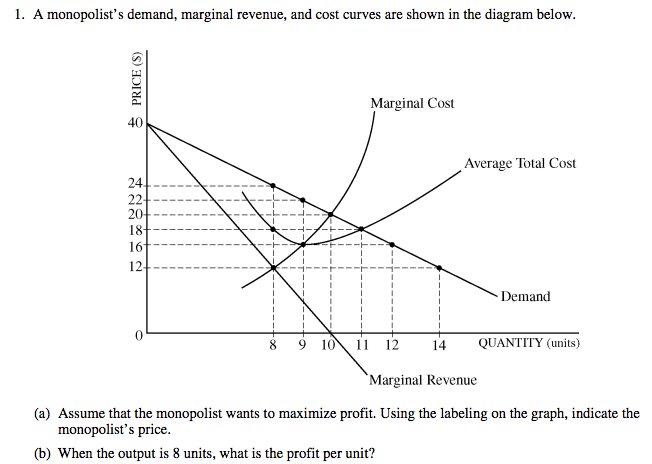
2011 AP Microeconomics FRQ, Q1
Economic profits = (P-ATC) x Q  but we are looking for profit for 1 unit, so, ($24-$18) x 1 = 6
                                  (P-ATC) x Q if we were looking for Total Profit = (24-18) x 8 = $56


Monopoly 1 - Characteristics, Downward Sloping Demand Curve, Marginal Revenue Curve, Elasticity

Monopoly 1 - Understand that Monopoly & Perfect Competition are the largest tested sections of the AP Micro. exam. The first question of the FRQ's has been PC or Monop. or a combination of the two for the last ten years, - know them!


Monopoly Video - mjmfoodie - 

Monopoly - a pure monopoly is a market structure that has only one firm selling a unique product, has price making power (price maker) and there are significant barriers to entry.


Monopoly characteristics being tested in the AP

2008 AP Microeconomics Exam

Answer - (C) Barriers to entry


But usually you will be tested using perfect competition and monopoly compared.

Example 1
Answer (B) The firm cannot affect the market price for its good.

Example 2

Answer (B) Increase - Decrease (This makes sense as monopolies can control the price of their products or the quantity but not both. Logically they would want a higher price with less quantity.)

Monopoly and Regulation - Video - Mjmfoodie

So how do we draw the revenue curves for a monopoly.


Demand Curve & Marginal Revenue Curve 
Notice the downward sloping demand curve (monopolists must lower prices to sell more) and the marginal return curve. Because the monopolist must lower its price to sell more units , its marginal revenue of a particular unit will always be lower than the price that unit sells for. (except at an output of 1).

Notice the MR curve breaks through the bottom axis,,, marginal revenue can be negative. When marginal revenue becomes negative is when Total Revenue begins to decrease.

Marginal revenue curve, Demand, TR and Elasticity


Graph above,, notice that as marginal revenue becomes negative, total revenue starts to decrease. Also notice,  that a monopolist with a price lower than R (on the above graph) would be producing in the lower section of its demand curve (the inelastic section) and that leads to decreasing profits,,, monopolists will not choose voluntarily to produce in this area. Monopolists choose to produce in the elastic sections of their demand curve...

2005 AP Microeconomics Exam
Answer (C) Demand for its product is price inelastic.

2008 AP Microeconomics Exam
Answer (B) elastic region of its demand curve

Welker Video - Monopoly


Monopoly, Profit max, PED (elasticity) - welker video


Saturday, October 25, 2014

Perfect Competition 3, Per Unit Tax & Subsidy

Perfect Competition 3, Per-Unit Tax & Subsidy

Subsidy - Humor


Per-Unit Subsidy - a sum given to the producer for each unit of good that is produced.

Per-Unit Tax - a tax imposed on the producer for each unit of good that is produced.

Lets do per unit tax first.


So, Short-run is on the left and Long-run is on the right.

Lets start with the short-run. The market graph is drawn showing supply and demand in equilibrium. Firms look at per-unit taxes as if they are extra costs added to the firms variable costs. Increases in variable costs will shift the marginal cost curve left. Variable cost increases will effect the ATC or Average total costs curve, the AVC and the MC curves.
  • A per-unit tax will shift the ATC upward, in the short-run the firm will have a loss due to the tax. Remember - that in the short run other firms cannot enter the market. The firms marginal cost curve is effected and shifts left with an increase in variable costs. (wages increase, production falls, tax increase, all cause the MC curve to shift left). Quantity will decrease.
  • In the long-run firms exit this industry. As more producing firms exit the market, supply decreases,  pushing up the market price and decreasing the quantity produced. In the long run the the price will increase to the point that the firm is only making normal profit/zero economic profit.
Per - Unit Subsidy


So, Short-run is on the left and Long-run is on the right.


Lets start with the short-run. The market graph is drawn showing supply and demand in equilibrium. Firms look at per-unit subsidies as if they are monies decreasing the firms variable costs. Decreases in variable costs will shift the marginal costs curve right. (decreasing wages, increasing worker productivity, and subsidies) Variable costs decreasing will effect the ATC or Average total costs curve, the AVC and the MC curves.
  • A per-unit subsidy will shift the ATC downward, in the short-run the firm will earn positive (super/abnormal) economic profits due to the subsidy. Remember - that in the short run other firms cannot enter the market. The MC curve will shift right. Quantity will increase.
  • In the long-run firms are attracted to this industry's abnormal profits and will enter the market. As more producing firms enter the market, supply increases,  pushing down the market price and increasing the quantity produced. In the long run the the price will decrease to the point that the firm is only making normal profit/zero economic profit.


Perfect Competition 2 - Lump Sum, Tax & Subsidy

Perfect Competition 2 - Lump-Sum, Tax & Subsidy

I have been tutoring some lately and have noticed that many students seem to have a bit of trouble with Lump-Sum & PerUnit taxes and subsidies within a perfect competitive market structure. While I have only seen this in one FRQ,, I believe 2008, Question, 1, I want to try and explain it and then we will do the 2008 FRQ and see if our graphs help us understand and answer the question...


Lump Sum Tax --A lump sum tax is a tax of a fixed amount that has to be paid by everyone (every firm in the industry) regardless of the level of his or her (its) income (production). (So no matter how much you produce or don't produce, you still have to pay this tax).

Lump Sum Subsidy - A lump sum subsidy of a fixed amount that is given to everyone (every firm in the industry).  Think of a subsidy like a gift or grant from the government for producing in the specified industry.

Subsidy humor


Lump-Sum Subsidy 


So, Short-run is on the left and Long-run is on the right.

Marginal Cost curves intentionally left off (as not effected) to show effects clearly,, feel free to add as Profit Max is where MR=MC.

Lets start with the short-run. The market graph is drawn showing supply and demand in equilibrium. Firms look at lump-sum subsidies as if they are monies added, decreasing the firms fixed costs. Additional decreases in fixed costs will not effect the variable costs and therefore won't effect marginal costs. Fixed cost increases will effect the ATC or (Average total costs curve) not the AVC or MC curves.
  • A lump sum subsidy will shift the ATC downward, in the short-run the firm will earn positive (super/abnormal) economic profits due to the subsidy. Remember - that in the short run other firms cannot enter the market. 
  • In the long-run firms are attracted to this industry's abnormal profits and will enter the market. As more producing firms enter the market, supply increases,  pushing down the market price and increasing the quantity produced. In the long run the the price will decrease to the point that the firm is only making normal profit/zero economic profit.
Lump-Sum Tax


So, Short-run is on the left and Long-run is on the right.

Lets start with the short-run. The market graph is drawn showing supply and demand in equilibrium. Firms look at lump-sum taxes as if they are extra costs added to the firms fixed costs. Increases in fixed costs will not effect the variable costs and therefore will not shift the marginal cost curve. 
  • A lump sum tax will shift the ATC upward, in the short-run the firm will have a loss due to the tax. Remember - that in the short run other firms cannot enter the market. 
  • In the long-run firms exit this industry. As more producing firms exit the market, supply decreases,  pushing up the market price and decreasing the quantity produced. In the long run the the price will increase to the point that the firm is only making normal profit/zero economic profit.
AP Microeconomics 2008, FRQ, question 1


So, (a) is asking for the short run market graph in equilibrium,, and the long run firm graph,, labelled appropriately, of course. This question is starting with everything in equilibrium.

(b) Notice, the underlined in the short-run. 
(i) Callahan's quantity of output? (Callahan's output/quantity doesn't change in the short-run as lump-sum subsidies are considered as an increase in fixed costs and therefore don't effect output/quantity produced.) (Variable costs are not effected therefore marginal cost is not effected.)
(ii) Callahan's Profit? (Callahan's profit definitely increases in the short-run)
(iii) The number of firms in the industry? (Tricky bastards) (The number of firms in the short-run never changes, look at the market graph in the short-run,,, firms only enter and exit in the long run.)

(c) Notice, the underlined in the long run.
(i) The number of firms in the industry. Explain (In the long-run the number of firms enter the market attracted to Callahan's abnormal profits) (Look at the long-run market graph.)
(ii) Price? (The price decreases as new firms increase supply, pushing down the price.)
(iii) Industry Output? (Industry output will increase.) (Look at the long-run firm graph and notice that the quantity is now at Q2, this makes since in that at the new lower price more quantity will be demanded and supplied by the firms in the industry.)

AP 2008 FRQ, Question 1 - Scoring Guideline


Both graphs in one,, for your learning pleasure.

Tuesday, October 21, 2014

Perfect Competition 1

Perfect Competition

Mjmfoodie - Perfect Comp. - Video

I wanted to post some new graphs that I created to push me to do some new blog posts.
Comments always welcome. :)


Obviously this is a perfect competition graph,,,

Firms in a perfectly competitive market are consider price-takers meaning that in this industry they can't manipulate the price of their goods. They can't do this because the market is saturated with firms all selling identical products. (Hint - perfect competition doesn't really exist) The closest markets are agricultural markets and they are often subsidized by their governments for various reasons: security (America & corn), patriotic bromides (Japan & rice), environmental (America and corn/ethanol) or tradition (America and sugar).

Profit - often students of economics don't quite get the references to a firm earning profits.

  • @ P1 the market is in short-run and long-run equilibrium, this means that the firm is earning a normal profit and all of its explicit and implicit costs are being covered. (Implicit in that the entrepreneur is earning enough profit to allow him to stay in this industry,,, more than his next best alternative) The AP exam uses normal profit and zero economic profit interchangeably.  They mean the same thing, (zero economic profit = normal profit)Notice that at P1 the firm is at a break even, meaning that all revenues are covering all costs. 
  • @P3 the price has risen above the firms ATC's (Average Total Costs). This price rise allows the firm to make Abnormal/Super/Positive Economic Profit, you must know that all of these terms when used,,, imply that the price has risen above where MC intersects with the ATC curve. When firms are makingAbnormal/Super/Positive Economic Profit, then we can expect other entrepreneurs/firms to rush into the industry to try and capture these profits. As more and more of these firms rush into this industry,,, the increase in supply causes prices to fall,,, falling prices causes inefficient firms to leave the market until we return to the previous level of equilibrium at P1, where P=minATC or Long-Run Equilibrium.
Lets look at it on a graph.

Notice that at P3 firms are making super/abnormal/positive economic profits. 

  • As more firms enter the market and increase supply, P3 to P1 (right shift) the price drops and inefficient firms exit the market.
  • Know that a perfectly competitive firm always produces to Maximize Profit, where MR = MC.
Why you ask?,,,, well.

MC = MR -  the firm’s total profits are maximized or losses are minimized - there is no reason to change the level of output, if it does it will be decreasing profits or increasing losses.

MR>MC - revenues are rising faster than costs so it pays the firm to increase output as in this way it will increase profits or decrease losses. There is money on the table. If the marginal unit is sold then more revenue will be collected. If more profit can be collected then the firm has not maxed profit. ** Ok, to often, this is very confusing to students,,, why? don't we want MR to be more than MC. NO,,, you want your revenues to be more than costs, but not your Marginal Revenues to be greater than your Marginal Costs... Explain,, you say,,

First, recognize that the word marginal here means either to sell or not sell one more unit. Would it increase our profit if we sold one more unit or would it decrease our profits. MR>MC, simply means that by selling that (one more unit)  or (more units) profits will be increased. {Lets use as an example the selling of a 3 million dollar plane. If your costs are 2 million and you sell the plane for 3 million, you have just increased the firms profits by 1 million dollars. If you had not sold the plane you would have cost the firm a million dollars in unrealized profit. If you can make one penny on a marginal sell,,(by selling one more) then you aren't at max profit until you make the sell}. Simple,, yes..

MC>MR - costs are rising faster than revenues, so it pays to decrease output as in this way the firm will increase profits or decrease losses.

Mjmfoodie - Profit Max - Video


What if the Price drops to P2?

  • @P2, the firm is now suffering some losses. At this price the firm will produce a quantity equal to Q2. Still at (MR = MC) to profit maximize. They are making losses but they are still covering some of their fixed cost. Why shouldn't they exit the market if they are making losses. Well, if they did exit the market they would still have to pay for all of their fixed costs. By staying in the market they can at least pay for some of their fixed costs. 
  • Remember that fixed costs are = to ATC - AVC. That rectangle that that includes LOSS & Area of fixed costs being Paid,,, is equal to all of the fixed costs. (ATC-AVC= AFC.)

What if the Price drops to P4?

  • Shut-Down is when price drops below the AVC. Once the price drops below P4, then the firm is not able to even pay its VC (workers) and to stay in business would be costing it money. Exit the Industry.

What if Demand Shifts lowering or raising price. If you understand the right sided graph it's easy to plug in the Demand Shift.


Points to Remember:

  • Break-Even - P=minATC
  • Profit Max - MR=MC
  • Shut-Down - P<AVC
  • A firm's MC curve above the AVC is its Supply Curve
  • Price will equal MC (Allocative Efficiency) - Allocative Efficiency exists when just the right amount, from society's point of view, is being produced. It requires that for the last unit produced, price is equal to its marginal cost (MC) or, more generally, that MSB=MSC.
  • Price will equal minimum ATC (Productive Efficiency) - When production takes place with a minimum average costs, implying that production takes place with minimal resource waste.
  • Perfectly Competitive industries are the most efficient type of Market Structure