Sunday, November 16, 2014

Perfectly Competitive Resource Market 1 - Perfectly Competitive Output & Labor

Perfectly Competitive 1 - Output & Labor 

Marketmjmfoodie - Factor Market Overview - video

mjmfoodie - Factor Market - Perfectly Competitive Factor and Output Markets - video
Perfectly Competitive Labor Market
  • (wage takers) - hire as many workers @ the equilibrium wage rate.
  • Market price is the wage rate.
Derived  Demand - demand for a resource, depends on other factors:
  • Price of the good the resource is used for.
  • Productivity of the resource
Input - (Labor) - is effected by the Law of Diminishing Marginal Returns
  • as more labor is added to a fixed amount of capital, output eventually decreases at an increasing rate.
  • demand for labor is inversely related to price
  • firms will only hire more labor if the wage rate falls

MRP (Marginal Revenue Product)

MRP is change in the firms total revenue resulting from the employment of one additional worker. It can be measured by the Marginal Physical Product of labor multiplied by the price of the good being produced. 

Reffonomics on MRP=MRC

MRP = 


MRP is (revenue attributed to the last worker hired)


The MRP curve shows/ illustrates the firms demand for labor.

MRC (Marginal Revenue Cost)

A firm faces a downward sloping demand for labor curve due to the decreasing productivity of labor in the short-run. 

In a Perfectly Competitive Market, MRC = the Wage Rate,  A wage taker is a firm that can hire as many workers as it wants at the market wage rate. Te cost of each additional worker, therfore, is simply the wage the firm must pay that worker.


Notice, that the wage rate for the firm is its supply curve and that it is perfectly elastic in that they can hire as many workers as they want at that prevailing wage.

Profit Max = (MRP = MRC)

If the cost of hiring an additional worker (MRC) is more than the benefit of hiring the worker (MRP) then the worker should not be hired. Conversely, if the benefit of hiring the worker (MRP) is hirer than the cost of hiring the next worker (MRC) then the worker should be hired.

A Perfectly Competitive employer will want to hire workers until the MRP of the last worker equals the market wage rate.


Examples:

2008B AP Microeconomics Exam


Make a chart:
a) after which worker do DMR set in,, by looking at MP we can see that the second worker produces an additional 16 units, an increase from the first workers output. Yet the third worker produces only 10 additional units a decrease from the 2nd workers additional output, thus diminishing marginal returns have set in after hiring the 2nd worker. Answer: after the 2nd worker

b) Calculate the Marginal Physical Product of the fifth worker. MPP is the change in the quantity of the total physical product produced divided by the change in input (labor/additional worker). Also known here as Marginal Product. The change in the fifth workers output was 44 to 49 units produced or 5 units were produced by hiring worker #5. Answer: 5 units

c) Calculate the MRP of the 3rd worker - done. Look at the chart - Answer: 3rd worker MRP = 20

d) How many workers will GW hire to Max Profit. Remember, max profit is where MRP = MRC, so looking down the chart the 5th worker's MRP is $10 while his MRC is $15.. we are loosing money on hiring the 5th worker. SO we look at worker 4, his MRP is $16 while his MRC (wage rate) is $15,, we are making a $1 on hiring him. As you can's hire a part of a worker,, we should consider profit max is at hiring of worker #4. Answer: hiring of worker #4

e) GW has fixed costs of $20, what are the Short-run profits of hiring 2 workers. Dirty bastards, they are trying to see if we know that the formula for profits is TR (total revenue) minus TC (total costs)... Knowing that , TC is a combination of fixed & variable, fixed being the $20 and variable being the wage rate of $15 per worker. So $20 plus $30 (15 x 2) = $50 dollars (TRC) - and TRP is the amount produced by the two workers (TP = 26 units times the price of the units) is $52 or you can simply add the MRP of worker 1 & 2 (20 + 32) = $52. So $52(TR) - $50(TC) = Profit of $2 dollars.

f) price of hats increases what happens to the number of workers in the short-run. Look at the chart below,,,, double the price and what happens to MRP,,, it increases.


Now, at what point with the new price would MRP = MRC,,, at worker #5,, worker #6 is still to expensive, but with the additional revenue from the rise in the price of the good (hats,,not labor) we would hire an additional worker,,, it works the same if productivity had increased. In the short run we would hire additional workers.


Sunday, November 9, 2014

Oligopoly

Oligopoly

Oligopoly - Video Jason welker
Oligopoly characteristics:
  • high barriers to entry
  • price making power
  • interdependence of firms
  • differentiated products
There have been by my count 5, yes, 5, years where oligopoly was an FRQ question. They were 2013, 2009, 2009B, 2007, 2007B. They are basically the same problem.

You are given a payoff matrix,

This matrix explains what the profits are depending on what each does. If LaPizza decides to advertise and PieCrust decides to advertise then they will both make a daily profit of $200 and $250 respectively.

You will be asked questions like:
  • What strategy should X company choose?
  • Who has the dominant strategy?
  • What is the daily profit.
  • If the two firms cooperate what will they do?
  • If the two firms act independently/simultaneously what will they choose?
  • If a subsidy/tax/new cost is added to a section of the matrix, draw a new matrix


Oligopoly AP Problems - for the love of Pete, make a chart.

Example - 1 - 2013
  • Pie Crust has a dominate strategy - no matter what the other firm does it will advertise.
  • La Pizza has no dominate strategy, what it does is dependent on what Pie Crust does.
  • Nash Equilibrium - Daily Profit - $450 & $300 - 


Example - 2 - 2009
  • Notice there is no dominate strategy, each should do the opposite of the other.
  • Cooperation leads to Blue going North & Red going South as they make more cash that way.

Example - 3 - 2007

  • Roadway has a dominate strategy because it should go early no matter what Rankin does.
  • Rankin has no dominate strategy, if Roadway chooses early it should choose early.
  • Daily Profit  for Rankin,,, go early.


mjmfoodie - oligopoly - video


Thursday, November 6, 2014

Monopolistic Competition

Monopolistic Competition

Assumptions
  • many buyers and sellers
  • heterogeneous/differentiated goods: (packaging, branding, after-sales service)
  • low degree of price setting
  • low barriers for entry and exit
  • imperfect information
Monopolistic Competition, video - mjmfoodie
Revenue Curves
  • Downward sloping demand curve
  • Relatively, but not perfectly elastic, demand curve
  • MR curve below Demand for same reason as monopoly
Profit Max in Short-run
  • Firm produces at profit max
  • Profits/losses possible in the short-run
Long-Run
  • Entry/exit in the long-run will eliminated profits/losses
  • Break-even only happens in the Long-run (like Perfect Competition)
Non-Price Competition
  • Branding - development of recognizable brand in an attempt to develop brand loyalty
  • Product Development - continuous improvement
  • Customer Service - good service increases demand
  • Location - convenient location increases demand
  • Advertising - makes buyers aware of products
Efficiency
  • Allocative Efficiency - (P = MC)
  • Productively Efficient - (P = minATC)
  • Monopolistic Competition neither achieves Allocative or Productive Efficiency
Monopolistic Competition compared to Perfect Competition
P (is higher)
Q (is lower)
Consumer Surplus (is less)
Allocative and Productive Efficiency (not achieved)
Product (differentiated)

Welker - Monopolistic Competition - Video

(Monopolistic Competition FRQ's 2009, 2007, 2004)

2009 AP Microeconomics Exam FRQ, Q1


Tuesday, November 4, 2014

Monopoly 9 - AP exam necessities


  • Total Profit = (P-ATC) x Q
  • Profit for 1 unit = (P-ATC) x 1
  • TR = (P x Q) 
  • Allocative Efficiency = (MC = D) or (P = MC) also called Socially Optimal Level/Quantity or Socially Efficient Quantity
  • Marginal Revenue is negative = inelastic section of Demand curve.
  • Marginal Revenue is  positive = elastic section of demand curve.
  • Zero Economic Profit = (P = ATC)
  • Positive Economic Profit = (P > ATC)
  • Losses(P < ATC) 
  • Profit Max = (MR = MC)
  • Max Revenue = (MR = 0) where TR is maxed.
  • Break-even = (P = ATC)
  • Unit Elasticity = (MR = 0)
  • Inelasticity = (MR < 0) or negative
  • Elasticity = (MR > 0) or positive
  • Demand curve is above MR, why? 
  • Economic Profit = TR - explicit - implicit
  • If you raise your price and TR (decreases) you are in the elastic section of Demand curve
  • If you lower your price and TR (increases) you are in the elastic section of the Demand curve
  • If you raise your price and TR (increases) you are in the inelastic section of the Demand curve
  • If you lower your price and TR (decreases) you are in the inelastic section of the demand curve
  • If demand shifts, what happens to P, Q, & MR?
  • Positive Accounting Profits = (covering explicit costs)
  • Opportunity Cost = implicit costs (implicit costs include entrepreneurs payment to self)
  • (MC > P) = (MSC > MSB) = Society has enough units of this product (Overproduction)
  • (P = MC) = Allocative Efficiency (MSB = MSC)
  • (MC < P) = (MSB > MSC) = (P > MC) = Society values more of this product (Underproduction)
  • Accounting Profit + Explicit Cost = Total Revenue
  • Accounting profit - implicit costs = Economic Profit
  • Economic Profit  = TR - explicit + implicit costs
  • Accounting profit = TR - explicit costs
  • Total Revenue - explicit costs = Accounting Profit
  • Monopoly is the industry thus it has a downward sloping demand curve
  • MR is less than Price(Demand) - for every level of output (except the first), why? - the lower price applies not only to the extra output sold but also to all prior units of output.

Monopoly 8 - Price Discrimination

Monopoly 8 - Price Discrimination

Price Discrimination Monopoly - Video - Welker

Price Discrimination -  exists when a producer charges a different price to consumers for an identical good or service.

Assumptions:
  • the firm must possess some degree of market power (downward sloping demand curve)
  • elasticity of demand is different in different markets
  • firm must be able to separate markets with similar elasticities  to prevent reselling

Video of 1st, 2nd & 3rd degree

First degree 

First degree discrimination, known as perfect price discrimination, occurs when a firm charges a different price for every unit consumed.

The firm is able to charge the maximum possible price for each unit which enables the firm to capture all available consumer surplus for itself. In practice, first-degree discrimination is rare.

Second degree

Second-degree price discrimination means charging a different price for different quantities, such as quantity discounts for bulk purchases.

Third degree

Third-degree price discrimination means charging a different price to different consumer groups. For example, rail and tube travellers can be subdivided into commuter and casual travellers, and cinema goers can be subdivide into adults and children. Splitting the market into peak and off peak use is very common and occurs with gas, electricity, and telephone supply, as well as gym membership and parking charges. Third-degree discrimination is the commonest type.

Necessary conditions for successful discrimination


Graph - 


  • More output
  • More profit
Many pay higher prices, but some pay below the single price

2013 AP Microeconomics Exam


Monopoly 7 - Lump-Sum & Per-Unit

Monopoly 7 - Lump-Sum & Per-Unit

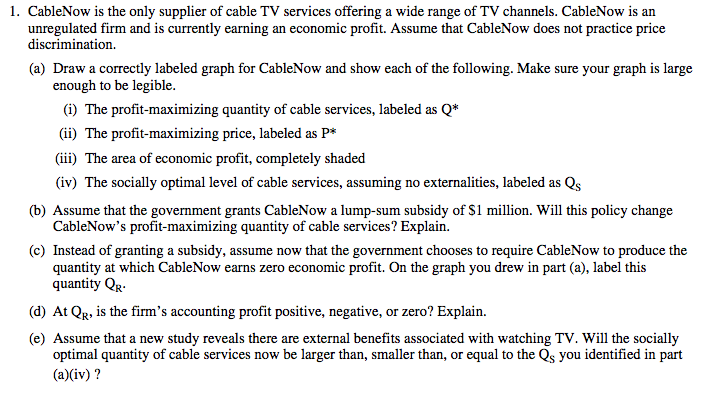
The AP exam will often ask you to correctly graph a monopoly firm's profits or loss and then evaluate what happens if a per-unit/lump-sum tax or subsidy is imposed/provided. 

You must know how to answer what happens to the firms, quantity, price, profits, consumer surplus, DWL, losses due to a per-unit or lump-sum.

Remember, a lump-sum is treated/viewed as a Fixed Cost (FC) and therefore will shift the ATC curve up(tax) or down (subsidy) but it will not effect the MC marginal cost curve.

*It appears that Subsidy and Tax are only asked/answered for short-run.  

Lump-Sum Subsidy - Monopoly 
Q- No change - (as MC not effected)
P - No change - (as MC not effected)
CS - No change - (as MC not effected)
DWL - No change - (as MC not effected)
Profits (increase) Losses (decrease)


Lump-Sum Tax - Monopoly
Q- No change - (as MC not effected)
P - No change - (as MC not effected)
CS - No change - (as MC not effected)
DWL - No change - (as MC not effected)
Profits (decrease) Losses (increase)


A per-unit tax is treated as a VC, variable cost and will shift the ATC up(tax) or down(subsidy) but it will also shift the MC curve left(tax) or right(subsidy).

Per-Unit Tax - Monopoly (graph to come)
Q - Decrease (MC will shift left and up)
P - Increase (MC will shift left and up)
CS - Decrease
Profits (decrease) Losses (increase)
DWL - Increase (less supplied DWL increases) “Quantity levels less than or greater than the efficient quantity create efficiency losses (or deadweight losses).”

Q is decreasing, price is increasing, profits (decrease) Losses (increase), DWL has increased as less is produced.


Per-Unit Subsidy - Monopoly (graph to come)
Q - Increase (MC will shift right and down)
P - Decrease (MC will shift right and down)
CS - Increase
Profits (increase) Losses (decrease)
DWL - Decrease (more supplied DWL decreases)  “Quantity levels less than or greater than the efficient quantity create efficiency losses (or deadweight losses).”

Q is increasing,  price is decreasing, profits (increase) Losses (decrease), DWL has decreased as less is produced.


Notice, the farther from Socially Efficient Quantity,, DWL increases. (anyone know something different, leave a comment)

 2012 AP Economics Exam FRQ, Q1


2007 AP Microeconomics Exam


Sunday, November 2, 2014

Monopoly 6 Consumer/Producer Surplus & DWL

Monopoly 6 Consumer/Producer Surplus & DWL

Consumer/Producer Surplus


Notice that where Allocative efficiency occurs Consumer Surplus and Producer surplus is maximized.

2008 AP Microeconomics Exam

Answer (D)
As we know that Profit max is a higher price and a lower output,, and allocative efficient level has a lower price (good for consumers) and more output (good for consumers), then we know that consumer surplus has increased. Think of this problem by focusing on what has changed.

2008B AP Microeconomics Exam FRQ, Q1

2006 AP Microeconomics Exam FRQ, Q1
Look at (iii) The museum maximizes the consumer/producer surplus.

Notice that where Allocative efficiency occurs Consumer Surplus and Producer surplus is maximized.

Answer (P4, Q3), where P=MC

DWL (Dead Weight Loss)

Remember that a monopoly is a form of market failure, thus it has DWL.
Welfare Loss, or dead weight loss - refers to decreases in producer and/or consumer surplus as a result of either more or less than the socially optimal level of output produced and consumed.

2003 AP Microeconomics Exam FRQ, Q2
Look at (C)(ii) Deadweight loss