Friday, March 11, 2016

Nominal vs Real / Money Supply vs Loanable Funds


Fiscal Policy = Loanable Funds = Real Interest Rate  
Monetary Policy = Money Market = Nominal Interest Rate


1) Loanable Funds

Loanable funds graph has the real interest on the vertical axis and the quantity of loanable funds on the horizontal. The supply curves show the amount of loanable funds that people have saved and are willing to loan. The demand curve is the businesses and individuals that would like to borrow. 
Equilibrium shows the real interest rate for the country.

The real rate of interest is crucial in making investment decisions. Business firms want to know the true cost of borrowing for investment. If inflation is positive, which it generally is, then the real interest rate is lower than the nominal interest rate. If we have deflation, and the inflation rate is negative, then the real interest rate will be larger. (Pride)

Loanable Funds = Money in banks that can be loaned out to individuals and firms

The real rate of interest is: (an eye on the price level/inflation)
  • the opportunity cost of borrowing/loaning money 
  • expressed in constant dollars (inflation adjusted value) 
  • value or purchasing power of money used
  • percentage increase in purchasing power the borrower pays (adjusted for inflation)
The real interest rate measures the percentage increase in purchasing power the lender receives when the borrower repays the loan with interest. 

The supply of loanable funds is based on the savings of the private sectors.

2) Money Market

The money market graph has nominal interest rate on the vertical axis and the horizontal axis is labeled the quantity of money. The supply of money is perfect inelastic as the money supply is controlled by the FED. The demand for money curve is downward sloping. Price level changes will effect the demand for money as will interest rate changes.


The nominal rate of interest is:
  • the opportunity cost of holding money
  • expressed in current dollars  (non-inflation adjusted value)
  • price paid for the use on money (no eye on inflation)
  • percentage increase in money the borrower pays (not adjusted for inflation)
The supply of money is based on the actions of the FED.

Why Nominal rates ?? -  the money supply deals with inflation and nominal value, not real value, while an increase in the money supply is the cause of Price level changes (inflation). 

In the long run an increase in the Money Supply will cause the demand for money to increase and the Nominal Interest Rate to rise.

Thanks, Michelle,,


Friday, February 26, 2016

Demand & Supply Question #2 AP Micro exam 2000


Answer - (D)  "The release of three summer movies set records for movie attendance"

 (A) If the wages of farm workers and movie theater employee increase, the supply of popcorn and movies will decrease (shift to the left).

 (B) If there is a technological advance in corn production, the supply of popcorn will increase (shift to the right).

(C) If there is more competition, price will decrease because of the increased number of sellers.

(D) "The release of three summer movies set records for movie attendance" means that the quantity demand of movie attendance increases. Since popcorn and movie attendance are complements, the demand of popcorn increases. As a result, the price increases and the quantity increases of popcorn.

(E) New government regulations increase the cost of production and, therefore, cause supply to decrease.


Tuesday, February 9, 2016

Growth, PPC, LRAS & Productivity


Growth - the increase of real GDP over time.


This can be shown in a number of ways.

On the PPC, movement from point A to point B is an increase in efficiency, usually point A is represented on the AP as unemployment. That which reduces unemployment causes a movement from A to B. 

The shifting out of the PPC (B to C) This can include more efficient use of resources, trade, increase in resources (finding of oil deposits) and increases in human capital (education and training) which implies increases in productivity.

Any point on the PPC boundary is where resources are being employed efficiently and is referred to as Potential GDP. Potential as this is the best a society could achieve with the available resources. 

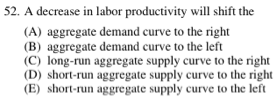
If the LRAS curve shifts to the right it implies that the full employment level of real output has increased. This means that there has been an increase in at least one of the following: technology, population, education, resources or capital stock. Productivity is thought of as a major driver of economic growth as labor productivity implies greater output per worker which is achieved through investment in natural capital, human capital and physical capital. 

Lets look at how the AP has used productivity in questioning students with multiple choice.

Answer - (E) More efficient steelmaking process
Technological improvements that increase the productivity of workers.

Answer - (C) Long-run aggregate supply
We see the connection between the PPC and the LRAS being questioned.

Answer - (B) The LRAS curve shifts right
Growth implies an increase in productivity

Answer - (E) LRAS shifts right
Again, technological improvements imply higher levels of productivity

Answer - (C) RIR increase
Capital stock, labor supply, tech, and increases in human capital all increase the long-run growth rate.


Answer - LRAS shifts right

Answer - SRAS curve left
I think the idea is that decreases in productivity must be a short-run effect. Interesting!

Answer - (C) population decreases
There are a few things going on that I don't like. First, the AP is testing you to see if you understand that a reduction in population (war, disease) will shift the LRAS curve leftward. Second, the confusion arises in my mind because standards of living will not improve  if there is war and/or disease. So this question seems to imply that smaller populations promote higher standards of living. I disagree. This question in my mind is contradictory and confusing.

Answer - (C) Labor Productivity
Draw a graph of the AD/AS Growth and notice that the PL has decreased and Output has increased.


Answer - (A)


Sunday, February 7, 2016

Perfectly Competitive (Profit) Profit Max

Profit Max = MR = MC
The goal of the firm is to maximise profits.

In a perfectly competitive firm the Quantity at which the firm should produce is where MR = MC.

Often students can't see it visually how a firm will max profits at the MR = MC point. I created a bit of a graphic to show the relationship between profit and profit max.
Below is profit viewed from a Total Revenue and total cost perspective. 


Notice that if a firm is producing anywhere to the left of profit max they should produce more as there is more profit to be made by producing more units. Producing to the right of profit max is where costs have risen to the point that to produce more lowers overall profits. So the firm should produce less.

Answer - (c) Experience a  decline in profits


How about a Perfectly Competitive graphic with profit curve.


Profit is maximised at the quantity where MR = MC.

Saturday, February 6, 2016

Economies of Scale (EOS) (Increasing, decreasing and constant) Cost Industries


Economies of Scale

Economies of scale can be classified into two main types: Internal – arising from within the company; and External – arising from extraneous factors such as industry size.


Internal has to do with efficiencies stemming from the fact that the company has become larger. Example: Due to the company now printing 10,000 flyers for their new product, cost per flyer has decreased. Companies tend to be able to negotiate lower prices for larger bulk orders. The lower costs push the short-run average total cost curves down and to the right.

External economies of scale have more to do with broad changes in the industry. Example: the introduction of computers into the business world have lowered costs for all businesses that choose to accept them.

The AP tends to ask questions about EOS in the multiple choice section and the FRQ section but they are looking for different aspects of the same thing.

I've tried to create a graphic to help explain EOS. Let's see if it can help.


First, lets look at the MC questions:
Answer - B The firm doubles its inputs and and output triples

If we look at the graph above we see EOS and increasing returns to scale on the left side of the long-run average total cost curve. Costs (EOS) are falling as output increases due to efficiencies. The doubling of inputs and output tripling is an example of increasing returns.

EOS or increasing returns to scale.
EOS tend to have to do with  a firm's costs while returns to scale have to do with addition of inputs and outputs in the long-run. They of course are closely related. I would say that the above question is a more increasing returns to scale question but I don't write the questions. Know that the AP exam relates the two as closely connected.

First Multiple Choice

Answer - E Long-run average total cost decrease as output increases

Again, by looking at the graphic above we see the LRATC curve is showing decreasing costs as output increases.

Economies of Scale has to due with long-run changes in the scale of production.

Answer - Diseconomies of scale

Answer - (a) The price will remain unchanged
(Demand increases and supply responds by increasing and pushing price back down to the original price)


The graphic above shows the differing ways that the sections can be referred to on the AP exam. 


Second FRQ's

The FRQ section of the AP gives you a guide when in the initial section of the question they speak about (Increasing cost industry -Decreasing cost industry - Constant cost industry) This is a warning that the LRATC curve will be discussed and you will be required to evaluate what happens to prices in the industry due to where the firm is on its  LRATC curve.

2015 Microeconomics  question #1


A constant-cost industry???? 

So in this question the firm is earning a positive profit, and profits attract other firms (firms enter) and supply increases which pushes the price lower.

The question would/could be how much lower as in lower than the original price, higher than the original price or equal to the original price.

In a constant cost industry supply will increase until the price is equal to the original price.

Example: 
So initially something happens in the short-run in the market, Demand increases. (D1 to D2)

This causes profits in the industry, profits firms enter, firms enter and supply increases (S1 to S2)

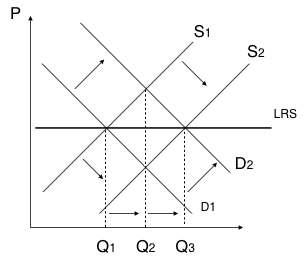
Supply increases to the original price. If a line is drawn between the original and the new equilibrium points we would get a horizontal line, this line is the Long Run supply curve.

2011B Microeconomics #1
Increasing Costs Industry - the firm is operating on the right side of the LRATC curve.

Here is what happens:


(C) Demand shifts right - price increases - causing profits - 


(D) (i) Profits attract firms (more firms) - supply increases - pushing down the price

Here is the important part::::

(ii) The firm's Short-run average total cost curve shifts up -  it is an increasing cost industry - costs are increasing - 

(i) Price has increased more than Pf.
(ii) Price is less than Pf2


If we look closely, we see that in an increasing costs industry, supply increases but not enough to lower price back to the original price. 

2008 Microeconomics #1

Constant Cost industry *****


So, Perfectly Competitive, Constant Cost in Long-run equilibrium
(b) Lump sum is given, which creates profits for the firm in the short-run
(iii) Number of firms can't change in the short-run,, tricky

(c) Indicate how changes in the Long Run

(i) Number of firms in the industry (Profits - firms enter - increases)

(ii) Price - Price will return back to the original price (price falls)

(iii) Industry Output 
(Demand increases and supply increase, price returns back to original price as it is a constant cost industry) Output in the industry increases


Monday, January 25, 2016

2013 Macroeconomics FRQ #3b (Expected Inflation)


Again, workers recognise that the PL is increasing and demand higher wages. They are able to get higher wages because the economy is overproducing and labor is in high demand. Higher wages cause business to decrease production (SRAS) shifts left. A shifting of the SRAS curve creates a corresponding shifting of the SRPC to the right. In the Long Run the  PL increases and the economy returns to the 6% natural rate of unemployment (NRU).

NIR = RIR + Expected Inflation (Not sure about numbers used, will fix tomorrow as it is late for me)

(Hat tip Ross & Meek)