Tuesday, April 28, 2020

ALL Perfect Competition FRQ's

ALL Perfect Competition FRQ's


2017 AP Microeconomics Exam

(A.) Draw a side-by-side graph of the corn market & firm that is perfectly competitive.
(i) Show Equilibrium price and quantity
(ii) Show the profit maximizing quantity with the firm earning zero economic profits.

The firm is producing at Profit Max (MR = MC)
The firm is earning Zero Economic Profit (Break-Even) (P = ATC)
All Explicit and Implicit costs are covered

(B.) Assume the demand for ethanol increases. Show what will happen to the following.
(i) The market price and quantity for corn.
(ii) The area of profit or loss earned by the corn farmer , shaded.
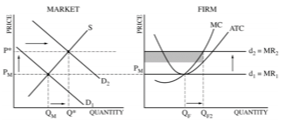
As the Demand for Ethanol increases
the Demand for Corn increases also, as Ethanol uses corn in its production
Demand for corn increases and price of corn increases
As the price of corn increases the Firm makes Positive Economic Profits and the firms quantity increases
as it has a new Profit Max (MR = MC)
(C.) Relative to your answer in part B, what will happen to the price and quantity of corn in the long-run? Explain.

If we are making Positive Economic profits in the short-run,
this attracts firm to enter the market in the Long-Run
As firm enter the Supply of corn increases and the 
price of corn falls the firms quantity decreases 
but the market for Corn has an increase in quantity
We return to long-run equilibrium making zero economic profits


(D.) Soybeans are produced in a perfectly competitive market. Assume farmers can grow either soybeans or corn. What happens to the price of soybeans in the next planting season if the price of corn increases? Explain.

If the Price of corn increases farmers are now making higher profits on corn, 
therefore they will plant more corn and less soybeans
less supply of soybeans means higher prices for soybeans
(E.) Assume the gov't sets a binding price on the price of corn. Draw a graph of the Corn Market showing the amount purchased.

Recognize that Qp the amount purchased is based on the amount supplied
doesn't matter how much is demanded,, if it ain't supplied you can't purchase it.


2015 AP Microeconomics Exam


2011 AP Microeconomics Exam


2011B AP Microeconomics Exam


2008 AP Microeconomics Exam


2005 AP Microeconomics Exam


2005B AP Microeconomics Exam


2003 AP Microeconomics Exam


2003B AP Microeconomics Exam


Monday, April 27, 2020

ALL Stagflation FRQ's

ALL Stagflation FRQ's

2006 AP Macroeconomics Exam

(A.)
Below Full Employment = Recession
(B.) Assume an increase in the world price of oil.
Stagflation can also be called a
Negative Supply Shock = Oil Shortage
Cost Push Inflation = Business Costs increase, Businesses will raise their prices
Inflationary Expectations = Expectations of increase in costs

(C.) What will happen to unemployment?
Always link unemployment with output
Output decreases unemployment increases


2005 AP Macroeconomics Exam

(A.) 
In the Short-Run, there is a trade-off between inflation and unemployment

(B.) Short-Run Aggregate Supply shifts to the left = (Stagflation)
(i) One factor that could have caused the shift left
(ii) Show the effect
Business Costs increasing shifts the SRAS curve left
Wages increased
Input prices increased
Business taxes increased
Productivity decreased

A leftward shift of the SRAS curve is
a rightward shift of the SRPC

(C.) Draw a CLG of the LRPC at 5%.

(D.) What is the relationship between inflation and unemployment in the long-run?

There is no relationship between inflation and unemployment
in the long-run.


2004B AP Macroeconomics Exam

(A.) Using an AD/AS graph show the increase in the price of oil.
(i) Real Output
(ii) Price Level

Oil price increase business costs as all business use gas for transportation
and electricity
the US gets about 85% of its electricity from coal, oil, natural gas
if oil prices increase electricity and transportation costs increase
leftward shift of the SRAS


(B.) Show the increase on the oil prices with a Phillips curve graph.


Lefts ward shift of the SRAS curve is a
rightward shift of the SRPC

(C.) Assume that the FED (Central Bank)  increases the Money Supply
(i) Explain how increasing the money supply will affect the AD.

Money supply increases and the Nominal Interest Rates decrease
NIR decrease increases investment which increases AD

(ii) Indicate how this will affect the PL and Output

MS increases, NIR decrease, Investment Increases, AD increases, PL increases, RGDP increases and Output increases


(D.) The government decides to reduce business taxes to get us out of the Stagflation scenario.

A decrease in business taxes will 
shift the SRAS curve to the right

Friday, April 24, 2020

ALL (Transfer Payments) FRQ's

ALL  Transfer Payments FRQ's


2011B AP Macroeconomics Exam

(A.) Economy is in Long-run Equilibrium, draw a graph
(B.) Consumer confidence falls.

Consumer confidence falls means that consumers are worried about the economy
and therefore will spend less
consumption (C) decreases and AD decreases
(E.) Draw a graph of the loanable funds market showing the effect on transfer payments on the real interest rate.

Transfer payments are payments for things like 
Welfare Benefits = payments to poorer citizens
Unemployment benefits = payments to citizens who have become unemployed
both of these increase when the country slides into a recession
More transfer payments implies the government must pay for these 
so Government Spending increases

If we slide into a recession and transfer payments increase then
Gs must increase to pay for the increase in transfer payments
the government has to borrow to pay for these transfer payments
this reduces the supply of loanable funds in the banks
driving up the RIR

It is also acceptable to say that as the Gs increases
then the demand for loanable funds increases
as the government borrows from the banks to pay for transfer payments
this increase in the demand for loanable funds
drives up the RIR,  increases.