Wednesday, January 11, 2017

2012 (Resource Costs) Labor, Multiple Choice

2012 Multiple Choice (Resource Costs) Labor
Labor Cheat Sheet Here.

Answer #26 (B) 4

Make a chart as these questions are almost always set up the same way.
Whatever chart you use do it the same way every time.
Understand that we hire at Profit max for labor which is where MRP=MRC, or as close as we can get.
So we would hire the 4th workers as she brings in $50 (marginally) and we pay her $40 in a wage,, this gives us a $10 profit on her hire. We would not hire worker #5 as he only brings in $25 and we would have to pay him $40,, this hire would cost us $15... We lose money on  the 5th hire.

Answer #27 (A) 19

What is the MPP??

Understand that this is the same formula for the MP,,
 as the change in labor for all of these problems changes by one.


Answer - (A) The marginal product per dollar spent on labor is equal to the marginal product per dollar spent on capital.

Least-Cost Post here.


Answer - (B) Horizontal and downward sloping

Understand that this is a recognition problem, if it is a 
perfectly competitive market, Demand curve is the MRDARP curve 
and
the Firm's Labor demand curve is the MRP curve and it is downward sloping.


Answer - (D) MRP = MFC

Understand that sometimes the AP uses Marginal Factor Cost and sometimes Marginal Resource Cost as the wage rate.
same same


2012 Multiple Choice (LRS/EOS)

2012 Multiple Choice (LRS/EOS)


Answer - (A) an increase in demand will cause no change in the long-run equilibrium price.

Understand that constant cost industries in long-run equilibrium are producing at the bottom of their SRATC and LRATC curves. They are productively and allocatively efficient. Firms can enter and exit and the price of the good will not be affected. The LRS (long-run supply) curve is horizontal or perfectly elastic. When demand increases then the industry supply will adjust in exact proportion to the increase in demand. Long-Run price returns to the original price.

LRS/EOS Cheat Sheet here.


Answer - (B) downward sloping

Long-Run Average Total Costs must be falling as when inputs are added output is larger proportionally than the inputs. Costs are falling as we add inputs. The LRS curve is downward sloping as the firm has economies of scale. (It needs to expand) - Demand increases and industry supply increases proportionally more than the change in demand as resource prices fall due to Economies of Scale. We are on the downward sloping section of our LRATC curve. 


Answer - (D) a higher short-run price for gadgets, followed by an increase in the quantity produced.

Understand that this question is asking the same thing as #10 above,
 but it is referring to short-run affects.
IN the short-run as population increases (demand determinate) demand increases causing prices to rise,,, and in the short term firms respond by increasing the amount of labor they have to take advantage of the higher price to make profits.
More labor is hired, MC's increase as more labor is hired until the firm reaches profit max (MR=MC)
In the long run firms will enter (chasing profits) and the competition will force prices back to the original long-run equilibrium price. Why? the original price? It's a constant cost industry.


Answer - (C) It's long-run average total costs will fall.

Understand that this question is the same as #22. If the firm is experiencing EOS its Long-Run ATC curve is downward sloping,, 
(meaning that they are producing on the LRATC where it is downward sloping)
Of course it can only do this in the long-run as capital can only be added and firms can only enter in the long-run. As it adds more capital or expands its total costs will fall (its LRATC's will fall) as we can se form the above graph.

Do you get it??????


Tuesday, January 10, 2017

Diminishing Returns vs. Economies of Scale

Diminishing Returns vs. Economies of Scale


DMR (Short-Run effect) - adding more inputs(labor) to a fixed factor of production(factory) will lead to increasing output but eventually as more inputs are added output will decrease and eventually become negative.

We understand this as we have graphed it quite a bit.
As we add our initial amounts of labor the marginal product (the output attributed to the next worker hired) increases as workers are more efficient (able to specialize) at their work. Adding more and more workers will increase the the TP (total product) output but at a decreasing rate. If we are foolish and keep adding workers the amount of output will eventually start to decrease and eventually become negative.

Understand that the MC curve is the cost of Labor and the MC curve above the AVC curve is the firms supply curve.

D = P = MR = AR
Short-run Adjustments (firm)
If MR > MC we should hire more workers (increase output)
if MR < MC then we should fire some workers (decrease output)
If MR = MC then we are at profit max,, optimal quantity of workers.


In the Short-Run the firm can only adjust its amount of labor (output). 
We adjust our amount of output (quantity) to maximise profit (MR=MC). This of course changes as the price of the good increases or decreases. As the (price of the good) increases we can make more profit and therefore hire more labor.


We adjust our labor to the profit maximising point where MRP=MRC, this is from the resource costs section of the course. (Usually taught at the end of the course)


Understand that the Max profit point is where MR=MC and where MRP=MRC,,,, if there was a quantity of labor that would create more profit then we wouldn't be at profit max. 
So if we are at MR =MC, then we must be where MRP=MRC.

If MRP > MRC we should hire more workers (increase output)
if MRP < MRC then we should fire some workers (decrease output)
If MRP = MRC then we are at profit max,, optimal quantity of workers.

Conclusion - In the short-run the firm must choose the optimal amount of labor to reach profit max (The firm and society in general is constrained by diminishing marginal returns) 


EOS - (Long-Run Effect) - Competitive advantages gained by a firm that expands its size. These include efficiencies such as buying in bulk and therefore reducing unit costs or having one human resource department shared between factories.

Adjustments - enter/exit of firms, increase or decrease of firm size

In essence, EOS depends on the size of firms that can fit into an industry. If demand for the good increases and as firms rush into the industry and our firm grows larger and resource costs still fall then we say the firm has economies of scale (EOS). The industry can handle more firms and existing firms should increase their size. The firms LRATC's are falling as they produce more output(quantity).

If the firm becomes to large and loses efficiency due to being to large, then diseconomies of scale will occur. 

If the industry has the right amount of efficiency and size then we will say that the industry is a constant cost industry and resource prices are not affected by firms entering or exiting the industry.

Check out the LRS/LRATC curve cheat Sheet here.

(not quite finished)


Conclusion - depending on the industry's economies of scale - (constant, decreasing, increasing) 

If a company can achieve EOS then the company should expand (produce more)
If the firm's to big increasing costs then they should reduce their size (produce less)
If a firm is of an efficient size (in a constant cost industry) the they are at productively and allocatively efficient. The firm is producing at the minimum of the SRATC and the LRATC curve.

Thursday, January 5, 2017

Perfect Competition (Long Run Supply/ATC Curves)

Perfect Competition (Long Run Supply/ATC Curves)

This stuff seems to give students crazy hard time. (because its complicated)
(see a problem drop me a line (wcwaugh@aol.com))

Creating this to mimic the AP College Boards FRQ's

1) Perfectly Competitive firm in long run equilibrium in a constant cost industry.
a) Demand increases (Price and quantity increases)
b) Firm makes profits (show) in SR
c) In the LR firms enter pushing supply back to original price.
d) Long Run supply curve is horizontal (firms enter but price of good doesn't change)
e) In a constant cost industry the firm is allocative and productively efficient


So, most FRQ's start with the firm in Long-Run Equilibrium and then market demand increasing/decreasing. The College Board asks you to show the effect of the market demand, profits/losses. 

Easy up to this point, Yes?

Then they ask you to explain what happens to the long run supply curve and what happens to the price in the market (compared to the original price).

Know that the Long Run Supply curve is simply a line drawn between the original equilibrium point and the equilibrium point after all firms have entered/exited the market. It shows the quantity supplied once producers have had time (long run) to enter/exit the industry.

Sometimes its easier to see the big picture or the flow of things. 

In essence the market is in equilibrium, no firms want to enter or exit as the existing firms are all making a normal profit. 

This implies that no adjustments need to be made.
No adjustments in the short-run (no labor needs to be hired or fired) and,
No adjustments in the long run (no firms entering or exiting the industry) 

then something happens (Demand increases) Why??? Look back at the Demand Supply Cheat Sheet!

Lets just say population increases,, so demand increases. (profits happen for firms)
These firms adjust in the short-run by hiring more labor.
Due to diminishing marginal returns firms might need to buy a larger factory and/or more machinery.
In the long-run (remember?) firms can enter/exit but also more capital can be added (factories and machinery) for firms that need to expand.
Supply increases but in this instance, supply increases proportionately more than demand had increased.
This is due to resource prices used in production decreasing marginally due to economies of scale.
More supply pushes the price of the good lower than the original price,, this happens again and again 

How does this look over time.

 Notice that demand increases but less than the supply curve increases. Prices are falling as firms get larger due to economies of scale. Think agriculture. At the turn of the last century in the US, 80% of the people worked on farms now the percentage is around 2%. Firms got more productive and much larger.

Food costs have fallen due to technology and the industry adjusted with different levels of labor/capital mixes.

What if we draw in the ATC curves in the short run. Here is the same graph above with the short-run atc curves drawn.

Understand that at each ATC curve is a point in time where the firm is back to equilibrium (normal profit) and has no reason to enter or exit. Then demand changes and firms scramble to supply more goods/services. As they hire more labor with the existing machinery/factories their costs rise and they decide to increase factory size. This increasing of factory/machinery lowers ((((marginal costs)))

Mr. Waugh, where is the Long-Run Supply Curve
Draw a line through all of the Long-Run Equilibrium points and you have your  Long-Run Supply Curve

Understand that in this decreasing cost industry, as demand increase, supply responds in ways that price falls in the market due to ATCs falling for the firm. 
There are connections to this graph.

In the above Firm graph,, if we are producing where MR>MC then we should produce more. How? Hire more people...   If we are producing where MC>MR then we should produce less. How?? Fire some people. We want to produce where MR=MC = Profit Max. This is the quantity society wants MC=MB from societies standpoint.

Now lets look at the Long-Run ATC curve with LRMR and LRMC

Left Side, a short run ATC and MC curve on a LRATC curve,, the Firm in the short run needs to increase in size, or more firms need to enter as costs can be driven down because of EOS.. More will be produced and society will pay for it. (((Assuming that the Demand increases)))

Right Side, this industry has to many firms or its firms are to large and costs are rising. Firms are to large or there are to many firms.

Middle - Constant cost industry, firms enter and exit without price changes. This is approximately the right amount of firms in this industry at this point.


Wednesday, January 4, 2017

Monopolistic Competition Cheat Sheet (Updated 01/04/2017)

Monopolistic Competition Cheat Sheet (Updated 01/04/2017)
Need a copy? E-mail wcwaugh@aol.com


Monday, December 26, 2016

2010 B Micro FRQ #1

2010 B Micro FRQ #1


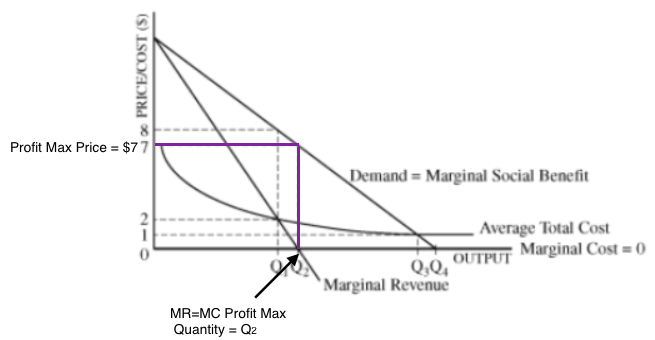
(A) Assume that the private firm owns the bridge and maximises profits. Determine the output and price.

This is why we learn the MR=MC rule and apply it to all maximising profit companies. Look for MR=MC and follow the lines, even when the college board thinks up a strange question like this.


(B) Now assume that a municipality owns the bridge and sets the price to achieve allocative efficiency . Determine the output and price.

From the Monopoly Cheat Sheet here.

Recognise and understand that Allocative Efficiency is where P = MC.


(C) At a price of $1, is the municipality's accounting profit positive, negative or zero? Explain.

Understand Accounting Profit: Profit Cheat Sheet Here.

Remember that Zero Economic Profit is positive accounting profit. At a price of $1, P = ATC.
This is a fair return or break-even price the monopolist will be making a normal or zero economic profit.


(D) Suppose the municipality sets a break-even price that generates revenue just to cover all economic costs.

(i) Based on the graph, determine break-even output.


(ii) At the output you determined in part (D)(i), is the demand relatively elastic, relatively inelastic, perfectly elastic, or perfectly inelastic or unit elastic.


(E) If a company provides access to the island via watercraft, what will happen to each of the following?

(i) The demand curve for bridge crossing.
Substitution causes the demand curve to shift to the left.

(ii) The profit maximising output.

If demand falls then output necessarily falls.


(F) Suppose the long-run average total cost curve is strictly downward sloping, would it be efficient to build a second bridge? Explain.

I have no problem stating that this problem is poorly worded and stumped quite a number of teachers of economics. Along with myself.

Take a step back and think about what you know:

1) The demand for this good is inelastic
2) Fair Return/ Break-Even price is $1
3) A competing water taxi will reduce demand for our bridge#1
4) The socially optimal quantity (SOQ) is 4 autos at a price of zero
5) To get more people to cross our bridge you would have to pay them - also inefficient
6) Building bridge #2 with a price of zero will just attract autos away from Bridge #1, & increase fixed costs and therefore Average Total Costs
7) This will raise Bridge #1's ATC's as the Demand curve for Bridge #1 shifts leftward.
8) Overall the municipality's ATC's will increase = inefficiency

I think,,, that the clue here is the understanding that allocative efficiency (Socially Optimal Quantity) is produced at a quantity of Q4. with a price of zero. Remember that the quantity is the number of cars crossing the bridge during the day and at a price of zero,, 4 autos cross that bridge. This is what society values as it is the SOQ and allocatively efficient level of production ..

Saying it another way,,,, If with one bridge at a price of zero demand is met. Then if we build a second bridge, the demand curve for bridge #1 will shift leftward (substitute) and its ATC's increase.

Saying it another way,,, There is no demand for a second bridge as the first bridge serves the socially optimal quantity (4) without raising the price above zero... in essence, because they are in the economies of scale section of the LRATC curve there is no reason to increase fixed costs (build another bridge) as the costs are still falling with increased production,,,, There is no reason to increase our fixed costs (bridge #2) until we have the need or demand.

One more point,, Obviously we want to produce were our ATC curve is lowest and as we are experiencing economies of scale we want to produce more but this is only efficient if there is enough demand. There isn't enough Demand. If we build a second bridge our fixed costs will increase and therefore our ATC will increase. This would makes us less efficient.